
Over 25 SMS vs email statistics for 2026 point to one clear trend: both channels still work, but the data you’ve been citing about SMS might be wrong. The oft-repeated “98% open rate” claim has been debunked by researchers with access to platform-level data, and the “$42 for every $1 spent” email ROI figure is similarly misleading. This post cuts through the noise with primary-source benchmarks from Klaviyo, EZ Texting, Litmus, Mailchimp, and Salesforce, so you can make channel decisions based on what the numbers actually say. For a broader look at how communication channels affect service quality, see our customer service statistics companion post.
Key Takeaways from SMS vs Email Statistics (2026)
- The 98% SMS open rate is not directly measurable. SMS platforms cannot track opens the same way email platforms can. Rally Corp researchers found the figure has no verifiable methodology behind it and recommends tracking CTR instead, where top SMS performers hit 15% or higher.
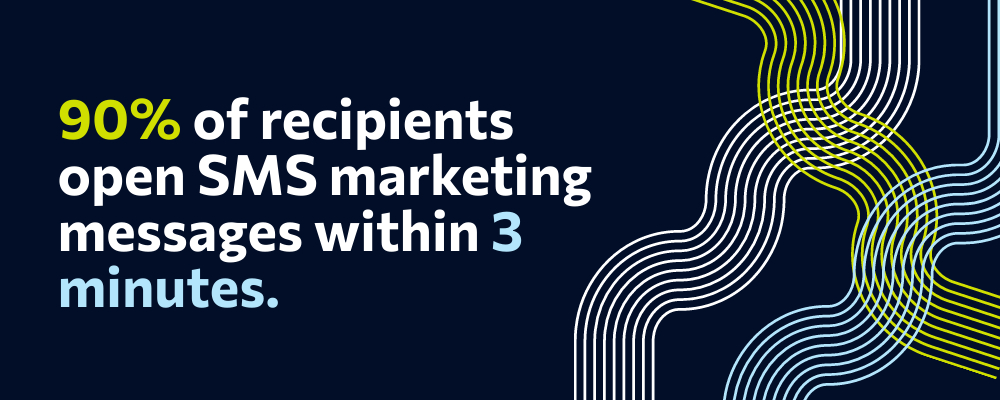
- Consumer opt-in to SMS is at an all-time high. According to EZ Texting’s 2026 Consumer Texting Behavior Report, 89% of consumers now expect texts from businesses they’ve opted in to, and 87% check those texts within 15 minutes of receiving them.
- Email ROI is a range, not a single number. Litmus’s 2025 State of Email found that 35% of marketers see $10–$36 per $1 spent, and 30% see $36–$50. The “$42:1” figure is an old industry average, not a guarantee.
- SMS flows punch above their weight. Klaviyo’s 2026 SMS Benchmarks show that SMS flows account for just 7.6% of total sends but drive 45.2% of SMS revenue.
- The real competitive edge is using both together. A Mailchimp survey of 1,205 mid-market marketing leaders found that 66% already use SMS alongside email, and 93% either have it in place or plan to add it.
The 98% SMS Open Rate Myth (and What to Measure Instead)
If you’ve cited the 98% SMS open rate in a presentation or a report, you’re not alone. It’s quoted everywhere. The problem: no one can tell you where it came from.
Rally Corp published a direct debunking of this figure. Their research found that SMS delivery platforms don’t have the read-receipt infrastructure that email clients have. When a message is delivered to a phone, carriers confirm delivery, not reading. There is no pixel, no tracking tag, and no reliable callback mechanism that tells a sender “this person opened the message.” The 98% figure appears to be an extrapolation from delivery rates, not actual engagement data.
Email open rates have their own accuracy problem. Apple’s Mail Privacy Protection (MPP), rolled out in iOS 15, pre-loads email pixels even when a user never opens a message. This inflates open rates across every email platform. Mailchimp’s current benchmark average of 35.63% almost certainly reflects some MPP-triggered phantom opens, particularly in consumer-facing lists with high iOS user concentrations.
What should you measure instead? For SMS, click-through rate is the most reliable engagement metric. According to Rally Corp, top-performing SMS campaigns hit CTR of 15% or higher. Klaviyo’s platform data (from over 183,000 brands) shows SMS flow CTR averaging around 10%, with the top 10% of flows generating more than $5 in revenue per recipient. For email, use click-to-open rate (CTOR) rather than raw open rate to filter out MPP noise.
SMS Marketing Statistics for 2026
Consumer opt-in and engagement
Consumer appetite for business SMS has grown steadily year over year. EZ Texting’s 2026 Consumer Texting Behavior Report (based on a nationally representative survey) found:
- 89% of consumers have opted in to receive texts from at least one business, up from 86% in 2025.
- 87% check incoming business texts within 15 minutes of receiving them.
- 67% say they are more likely to purchase from a brand that communicates with them via text.
- Consumers prefer texting over phone calls, email, or app notifications for 9 out of 10 message types tested in the survey.
- 79% will subscribe to a brand’s SMS list without making a purchase first, according to EZ Texting’s 2025 Consumer Texting Report.
Business adoption of SMS marketing
SMS is no longer a novelty channel. SimpleTexting’s 2025 SMS Marketing Statistics report surveyed hundreds of businesses actively running SMS programs and found:
- 66% of businesses now use SMS marketing software to communicate with customers.
- 36% report click-through rates between 21% and 35% for their SMS campaigns, well above platform averages, suggesting strong list hygiene and segmentation.
- 32% report conversion rates between 21% and 30% for SMS-driven campaigns.
For abandoned cart recovery specifically, Postscript’s 2026 SMS Benchmarks (data from 17,000+ Shopify stores) put abandoned cart SMS CTR between 9.5% and 17.3%, with conversion rates of 4.0%–7.8%. Back-in-stock SMS performs even better: CTR of 36.7%–58.7%, making it one of the highest-performing automated message types on any channel.
Industry-specific SMS adoption
SMS adoption rates vary widely by sector. SimpleTexting’s 2025 data shows the industries leading adoption:
- Healthcare: 83% of providers use SMS for appointment reminders, follow-ups, and patient communications.
- Hospitality: 80% use SMS for reservations, check-in reminders, and loyalty program updates.
- Finance: 72% use SMS for account alerts, payment reminders, and fraud notifications.
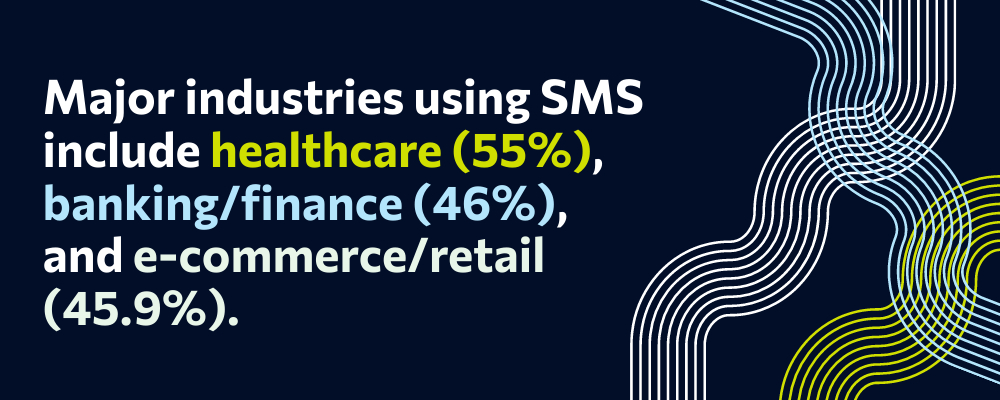
Note: The graphic above reflects earlier survey figures. Updated 2025 data from SimpleTexting shows higher adoption: Healthcare 83%, Hospitality 80%, Finance 72%.
Email Marketing Statistics for 2026
Open rate and CTR benchmarks by industry
Email remains the highest-volume digital marketing channel by a wide margin, with over 4 billion daily users globally. Mailchimp’s Email Marketing Benchmarks report (updated regularly from billions of campaign sends) shows the following averages:
- Average open rate: 35.63% across all industries (remember: inflated by Apple MPP).
- Average click-through rate: 2.62% across all industries.
- Nonprofits perform best with a 40.04% open rate.
- Ecommerce averages 29.81% open rate and a CTR around 2.65%.
Omnisend’s 2026 Ecommerce Marketing Report (sourced from 150,000+ merchants) puts the global email open rate at 30.7%, with automated flows averaging 38%. Automated emails consistently outperform broadcast sends because they trigger off behavior, not a calendar date.
Segmentation and personalization lift
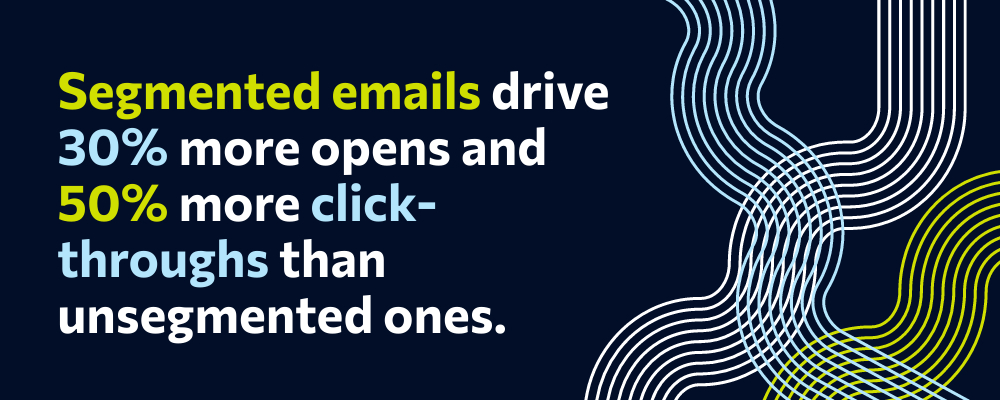
Segmentation is where email marketing earns its reputation. HubSpot’s State of Marketing data shows that segmented email campaigns drive 30% more opens and 50% more clicks compared to unsegmented sends. That’s not a marginal gain. It’s the difference between a campaign that pays for itself and one that doesn’t.
78% of marketers surveyed by HubSpot cite audience segmentation as the single most effective email marketing strategy. List hygiene and behavioral triggers follow closely behind. For teams managing high-volume customer communication, this reinforces the case for ways to improve customer service by using channel data to personalize touchpoints rather than broadcasting generically.
B2B email dominance
In B2B contexts, email has no serious rival. HubSpot’s State of Marketing reports that 59% of B2B marketers identify email as their most important channel for revenue generation. Social media, paid search, and webinars all trail significantly. The reason is structural: B2B buying cycles are long, buyers need multiple touchpoints, and email is the only channel that scales content depth (case studies, reports, proposals) while maintaining a 1:1 feel when personalized properly.
SMS vs Email Performance Benchmarks (Side-by-Side)
The table below uses platform-level benchmark data, not survey estimates. Where a metric is not directly trackable (like SMS open rate), we’ve noted the correct proxy.
| Metric | SMS | Source | |
|---|---|---|---|
| Open rate | Not directly trackable (delivery rate ~98%) | 35.63% avg (MPP-inflated) | Rally Corp; Mailchimp |
| Click-through rate | Top flows: ~10%; top 10% of flows: 15%+ | 2.62% avg; automated: higher | Klaviyo; Mailchimp |
| Abandoned cart CTR | 9.5%–17.3% | Varies by automation setup | Postscript |
| Back-in-stock CTR | 36.7%–58.7% | Typically 5%–15% | Postscript |
| Conversion rate | 21%–30% (high-performing campaigns) | 1.9% avg; higher for automated flows | Omnisend 2026 |
| Response time | 87% read within 15 minutes | Hours to days (varies) | EZ Texting 2026 |
| Unsubscribe rate | Under 3.5% (well-managed lists) | 0.1%–0.5% avg | Postscript; Mailchimp |
| Best for | Time-sensitive, transactional, short-form | Long-form, nurture, B2B, content-rich | Multi-source |
SMS vs Email ROI: What the Data Actually Shows
The “$42 for every $1 spent” email ROI figure has been cited so often it’s treated as fact. Litmus’s 2025 State of Email tells a more accurate story: ROI varies widely by company type, list quality, and automation maturity.
- 35% of marketers see returns of $10–$36 per $1 spent.
- 30% see $36–$50 per $1 spent.
- 5% report $50+ per $1 spent.
- Agency and retail accounts average $42:1 and $45:1 respectively in Litmus data, which explains where the industry average comes from.
Omnisend’s 2026 data from its own merchant base paints an even more optimistic picture: merchants using Omnisend’s platform average $76 for every $1 spent on email marketing. That figure reflects automated flows, segmentation, and cross-channel coordination, not basic broadcast campaigns.
For SMS, the ROI story is about flows, not blasts. Klaviyo’s 2026 SMS Benchmarks (across 183,000+ brands) show that SMS flows account for only 7.6% of total SMS sends but generate 45.2% of all SMS revenue. The top 10% of SMS flows generate more than $5 in revenue per recipient per send. That’s not a volume game. It’s a targeting and timing game.
The honest comparison: email wins on cost-per-send at scale, SMS wins on immediacy and engagement intensity. Neither metric exists in isolation from your list quality, automation sophistication, or message relevance.
DMIBPO Channel Fit Matrix: When to Use SMS vs Email
The statistics above tell you how each channel performs in aggregate. This matrix tells you which one to use for a specific message type, based on what the data shows about intent, urgency, and format fit.
| Message Type | Recommended Channel | Rationale | Benchmark CTR / Conversion |
|---|---|---|---|
| Appointment reminders | SMS | 87% of recipients read within 15 min; reduces no-shows by up to 38% | CTR 15%+; healthcare adoption 83% |
| Flash sales and promotions | SMS | Time-sensitive offers need immediate delivery; 67% more likely to purchase after SMS | CTR 9.5%–17.3% (Postscript) |
| Order and shipping confirmations | SMS or Email | Either works; SMS for instant visibility, email for detailed tracking info | Automated email open rate 38% (Omnisend) |
| Cart abandonment | SMS first, Email follow-up | SMS cart CTR 9.5%–17.3%; email follow-up reaches inbox-checkers on different schedule | SMS conversion 4.0%–7.8% (Postscript) |
| Password resets and account security | SMS | Security messages need immediate delivery and high visibility; email risks spam filters | Delivery rate near 98% |
| Onboarding sequences | Content-rich onboarding needs space for detail, links, and attachments; email delivers this | Automated email CTR higher than broadcast | |
| Newsletter content | Long-form content, brand storytelling, and curated links belong in email; SMS length limits apply | Avg open rate 35.63% (Mailchimp) | |
| NPS and satisfaction surveys | SMS | Higher response rates for short SMS surveys; 1-click rating links outperform email survey forms | SMS response rate 2x–3x vs email surveys |
| Billing notices | Billing requires a paper trail and detail; email provides both; SMS for overdue urgent follow-up | Finance SMS adoption 72% (SimpleTexting) | |
| Reactivation campaigns | Email, then SMS | Start with email to respect preference; use SMS only if email goes unanswered for 60+ days | Segmented re-engagement email: 30% more opens |
Digital Minds BPO has managed customer communication channels for clients across healthcare, ecommerce, financial services, and hospitality for over 15 years. What our teams have seen consistently: the companies that get this right don’t pick a channel and stick with it. They pick a channel per message type, and they review the data quarterly to see if it’s still the right call. SMS preferences for appointment reminders in healthcare are not the same as SMS preferences for billing in finance. Segmenting your channel strategy by message type, not just by industry, is where the real performance gains live. For more on building a high-performing social media customer service layer alongside SMS and email, see our channel-specific breakdown.
SMS + Email Combined Strategy Statistics
The most useful statistic in this post might be the simplest one: most successful brands don’t choose between SMS and email. They use both.
A Mailchimp survey of 1,205 mid-market marketing leaders found that 66% already use SMS alongside email, and another 27% plan to add SMS. That’s 93% penetration or stated intent, which effectively means cross-channel communication is the baseline expectation for mid-market brands, not an advanced strategy. For teams using live chat as a third channel, the coordination gains compound further.
The customer side of the data is just as clear. Salesforce’s State of Marketing 2026 (surveying 4,500 marketing professionals) found that 83% of customers want two-way dialogue with brands rather than one-way broadcast messages. Yet 69% of marketers say they struggle to respond to customer inquiries promptly, and 84% admit their campaigns are more generic than they should be. The gap between what customers want and what brands deliver is still wide.
Filling that gap is where understanding the difference between customer service and customer support becomes relevant. SMS and email aren’t just marketing channels; they’re service channels. How you respond to a billing question over email or a complaint via SMS shapes retention just as much as any promotional campaign.
Methodology and Sources
A few notes on how to interpret the statistics in this post, because context matters more than the numbers themselves.
SMS “open rate” is not directly trackable. Unlike email, SMS has no pixel-based tracking. Delivery confirmations come from carriers, not recipients. When platforms report “open rates” for SMS, they are typically reporting delivery rates or inference-based estimates, not verified reads. Use CTR as your primary SMS engagement metric.
Email open rates are inflated by Apple MPP. Since iOS 15, Apple’s Mail Privacy Protection pre-loads email tracking pixels regardless of whether a user opens the message. Any email benchmark published after September 2021 that does not acknowledge MPP should be treated with caution. The Mailchimp figures cited above reflect real-world averages that include MPP-affected opens.
Platform data vs. survey data are different things. Klaviyo’s SMS benchmarks come from 183,000+ active brands and reflect actual send/click/revenue data. Postscript’s benchmarks come from 17,000+ Shopify merchants. These are platform-level observations. EZ Texting’s consumer data (N=959 in 2025; nationally representative in 2026) and Mailchimp’s survey data (N=1,205) are self-reported. Both types are useful; neither type should be treated as universal law.
Recency window. All statistics cited in this post are sourced from 2024–2026 publications. We have not included figures from pre-2024 research, given how rapidly channel behavior shifted post-MPP and post-COVID. If you’re reading a competitor post that still cites 2020-era open rate figures, the numbers are likely stale.
Frequently Asked Questions
What is the average SMS open rate and is the 98% figure accurate?
The 98% figure is not verifiable. SMS platforms confirm message delivery, not whether a recipient actually read the message. Rally Corp’s research found no reliable methodology supporting the 98% claim, and recommends tracking CTR instead. Top-performing SMS campaigns achieve click-through rates of 15% or higher, which is a far more meaningful benchmark than an unverifiable open estimate.
What is the ROI of SMS marketing compared to email marketing?
Email ROI ranges from $10 to $50+ per $1 spent depending on automation maturity, list quality, and industry, per Litmus’s 2025 State of Email. Omnisend merchants average $76 per $1 spent. For SMS, the ROI case is strongest in automated flows: Klaviyo data shows SMS flows drive 45.2% of SMS revenue despite representing only 7.6% of sends. Direct ROI comparison is difficult because SMS cost-per-message is higher than email cost-per-message; the value depends on message type and timing.
When should I use SMS instead of email for customer communication?
Use SMS when the message is time-sensitive, short, and action-oriented: appointment reminders, flash promotions, cart abandonment nudges, shipping alerts, and security notifications. Use email when the message benefits from length, visual design, or a paper trail: onboarding sequences, newsletters, billing, and B2B nurture. For best results, see our Channel Fit Matrix above, which maps 10 message types to the appropriate channel with benchmark data.
What percentage of consumers have opted in to receive texts from businesses?
As of EZ Texting’s 2026 Consumer Texting Behavior Report, 89% of consumers have opted in to receive texts from at least one business, up from 86% in 2025. Opt-in intent is even higher among younger demographics. Importantly, 79% of consumers will opt in to a brand’s SMS list before making a purchase, meaning SMS is a useful awareness and nurture tool, not just a post-purchase channel.
Is it better to use SMS and email together or focus on one?
The data supports using both. Mailchimp’s survey of 1,205 mid-market marketers found that 66% already use SMS alongside email, and 93% have it in place or plan to add it. The channels serve different functions: SMS handles urgency and immediacy, email handles depth and nurture. Forcing a choice between them creates gaps in your communication coverage. Start with email if you’re resource-constrained, but build toward cross-channel coordination as your list and team mature.
How much does adding SMS to email campaigns increase conversion rates?
Cross-channel lift varies by use case, but the category-level data is strong. For cart abandonment specifically, combining SMS (CTR 9.5%–17.3%, conversion 4.0%–7.8% per Postscript) with email follow-up consistently outperforms either channel alone because it reaches customers on different schedules and through different attention contexts. Salesforce research shows 83% of customers want two-way dialogue with brands, and cross-channel presence is the closest approximation of that expectation at scale.
How is SMS open rate measured differently from email open rate?
Email open rates are tracked via a small invisible image (pixel) embedded in the message. When the email client loads the image, the send platform records an open. Apple MPP broke this mechanism for iOS users by pre-loading pixels automatically. SMS has no equivalent tracking mechanism: carrier delivery receipts confirm a message reached a device, not that a person read it. This is why SMS CTR (tracked via link clicks) is the correct engagement metric, while email CTOR (click-to-open rate) is more accurate than raw open rate in a post-MPP environment.
Final Thoughts
The SMS vs email debate has always been a false choice. The statistics in this post point to the same conclusion from multiple directions: SMS wins on immediacy and engagement intensity, email wins on depth and cost efficiency at scale, and the brands getting the best results from both use them for different jobs. Choosing a channel should start with the message type, not a blanket platform preference.
What the data also shows, and what too few marketing guides acknowledge, is that the quality of your customer communication operation matters as much as the channel you choose. A perfectly timed SMS sent by an overwhelmed two-person team with no follow-up protocol is not a strategy. Proper management of customer service quality across channels, including SMS and email, is where retention is actually built.
If your team is stretched thin handling inbound email and SMS volume, Digital Minds BPO, a business process outsourcing company based in Naga City, Philippines with 15+ years of experience and a 92% client retention rate, offers dedicated email support services and broader customer service solutions for growing businesses. We handle the volume. You focus on the strategy.

Charvel Rebagay is the CEO and Founder of Digital Minds BPO, a Philippines-based outsourcing company he established in 2010. Based in Naga City, he works directly with clients and teams daily to ensure service quality across every engagement. With over 15 years of experience building and managing dedicated teams for businesses worldwide, Charvel has helped hundreds of companies scale their operations through skilled Filipino professionals. Under his leadership, Digital Minds BPO operates 3 dedicated facilities with a 94% client retention rate, serving Fortune 500 clients including P&G and Petron.