Live chat statistics tell you a lot about how customers actually want to be helped in 2026, and the numbers are shifting fast. Response time expectations are tighter. Satisfaction scores for chat are pulling ahead of phone and email by a wide margin. And businesses that still treat live chat as an optional add-on are leaving measurable revenue on the table.
We pulled together 40+ live chat statistics for 2026, sourced from Kayako, SuperOffice, Smartsupp, Tidio, Forrester, Allied Market Research, and Invesp. You’ll find data on customer satisfaction, response time benchmarks, agent performance, channel cost comparisons, chatbot adoption, and market growth. These are the numbers that matter for anyone building or optimizing a live chat program in 2026. Check out our 50+ customer service statistics for 2026 for the broader channel context.
Key Takeaways from Live Chat Statistics in 2026
- 95% of customers value quality over speed when using live chat, yet speed still triggers abandonment when response times stretch past a few minutes (Kayako).
- Live chat CSAT is 73%, compared to 61% for email and 44% for phone. That 29-point gap over phone is the clearest channel-quality argument in the data (Kayako).
- The average live chat response time is 2 minutes 40 seconds, but 21% of companies never reply at all (SuperOffice, 2022 study of 1,000 websites).
- Customers who chat are 513% more likely to complete a purchase than those who don’t (Kayako). That single stat reframes live chat from a support cost to a revenue driver.
- The global live chat software market is on track to reach $1.7 billion by 2030 at an 8.8% CAGR (Allied Market Research).
Customer Preference Statistics: Live Chat vs Phone vs Email
Understanding which channel customers actually prefer changes how you staff and budget. The data here is more detailed than a simple preference ranking: it shows why customers choose chat, which demographics drive adoption, and where businesses are still missing the mark.
1. 41% of customers prefer live chat over phone and email for real-time support.
Tidio’s platform data, drawing from over 2 million conversations, puts chat preference at 41% of customers. That figure has grown steadily since 2019, when Forrester pegged it at 27% for US online adults. The jump reflects how much the channel has matured.
2. 42% of US online adults say live chat is an important feature on a website, up from 27% in 2019.
Forrester’s State of Chat in Retail research tracked this preference jump over three years. The 15-point increase is a direct reflection of how the pandemic accelerated digital-first shopping habits. For businesses, it means live chat has moved from “nice to have” to a baseline expectation for a growing share of customers.
3. 63% of customers prefer live chat as their primary support communication channel.
Invesp’s industry-wide data puts live chat ahead of other channels for primary support preference. Email remains widely used, but customers who can choose between chat and email default to chat for immediacy. The preference is especially strong among customers with time-sensitive questions about orders or account issues.
This demographic isn’t just comfortable with chat. They expect it. McKinsey’s research on digital channel preference shows Gen Z customers are more than twice as likely to start a support interaction through a digital channel than to call a phone number. For businesses targeting younger buyers, a missing or slow live chat is a genuine churn risk. You can see how different customer service channels stack up across demographics in our breakdown of different customer service channels.
5. 1 in 5 customers will drop a product or service if live chat support is slow.
Speed doesn’t just affect satisfaction scores. It affects retention. Invesp’s data shows that 20% of customers who encounter a slow live chat interaction will switch to a competitor. This is why response time benchmarks (covered below) are operational KPIs, not just metrics for a dashboard.
6. Over 30% of customers expect live chat to be available on any website they visit.
This expectation isn’t limited to ecommerce. B2B buyers and service customers now arrive at websites expecting a chat widget. Businesses without one are already behind the baseline for a growing share of their visitors. Smartsupp’s platform data across 175,000+ active installations confirms just how broadly live chat has penetrated across business types.
Live Chat Customer Satisfaction (CSAT) Statistics
CSAT scores are the clearest signal of how well a live chat program is working. The benchmarks below come from primary research, not aggregated estimates, so they’re worth holding your team’s numbers against.
7. Live chat CSAT is 73%, compared to 61% for email and 44% for phone.
Kayako’s survey of 1,000+ US consumers put these numbers side by side, and the gap is striking. Chat outperforms phone by 29 percentage points. That’s not a marginal difference. It reflects the structural advantage chat has over phone: no hold music, no forced wait, no repeating your account number three times. The 17 live chat best practices our team has compiled are largely built around maintaining this advantage at scale.
8. 87% positive CSAT is the top-quartile benchmark for well-run live chat programs.
Tidio’s 2026 platform data, pulled from over 2 million conversations, sets the bar for high-performing teams at 87% positive CSAT. If your program is sitting below 75%, that’s a signal to look at response time, first contact resolution, or agent training before adding more volume.
9. A CSAT score of 75 or higher is the industry benchmark for excellent live chat performance.
A +75 CSAT is cited consistently across contact center research as the threshold between acceptable and excellent. Businesses below this benchmark generally share two traits: response times above 3 minutes, and agents handling more concurrent chats than their training supports. Both are solvable.
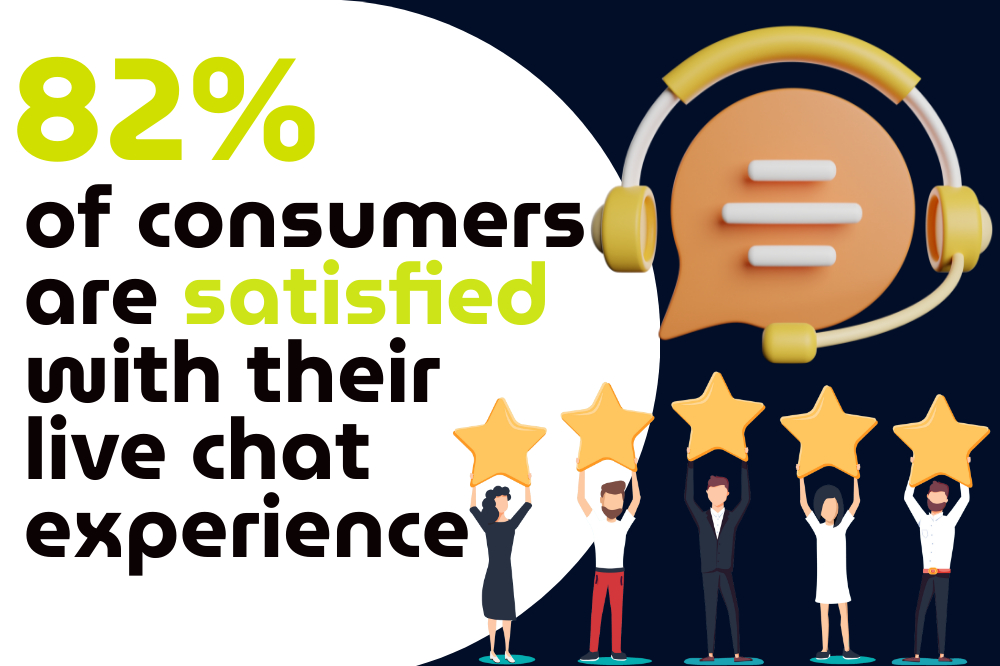
10. 82% of customers report being satisfied with their most recent live chat experience.
This Invesp industry-wide figure is higher than the Kayako CSAT benchmark because it measures general satisfaction (“were you satisfied?”) rather than a scored rating. Both numbers point in the same direction: customers who actually reach a live chat agent come away positive at a rate that no other channel consistently matches.
11. 84% of customers abandon a live chat session due to frustration before it’s resolved.
Kayako’s data surfaces a troubling gap: even with high satisfaction scores for completed chats, 84% of customers who get frustrated will bail before the conversation ends. The triggers are consistent: slow response, scripted answers that don’t fit the question, and being transferred without context. Reducing this number is where CSAT gains are actually found.
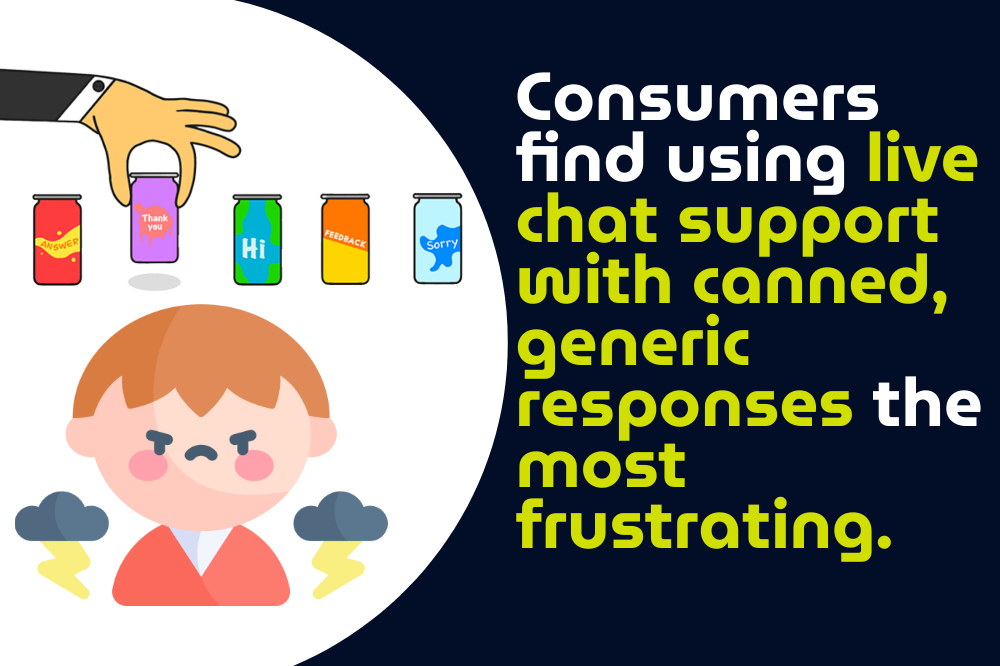
12. 35% of customers name scripted, impersonal responses as their biggest live chat frustration.
Kayako’s survey asked customers what frustrated them most. Scripted responses topped the list at 35%, ahead of slow responses and being put on hold. This is relevant for teams that rely heavily on canned responses for speed: the time savings come at a real cost to experience quality, especially for customers with anything above a basic question.
13. 29% of customers tell others about a poor live chat experience.
Nearly 3 in 10 customers who have a bad chat interaction share it. Kayako’s data frames this as a reputation risk, not just a satisfaction metric. One frustrating chat doesn’t just lose that customer. It potentially affects the decisions of everyone they tell. This is why call center performance benchmarks treat CSAT as a leading indicator of churn and word-of-mouth impact.
14. 4.3 out of 5 is the average conversation rating across Smartsupp’s platform, based on 4.8 billion website visits analyzed.
Smartsupp’s 2024 platform analysis is one of the most statistically solid datasets in live chat research, covering 175,000+ active accounts and nearly 5 billion visits. A 4.3/5 average rating across that volume suggests that live chat, when set up and staffed correctly, delivers consistently positive experiences at scale.
Live Chat Response Time Statistics and Benchmarks
Response time is the single most controllable driver of live chat CSAT. The data here gives you real benchmarks to compare against: what the average looks like, what the best teams achieve, and what customers will and won’t tolerate.
15. The average live chat first-response time is 2 minutes 40 seconds.
SuperOffice tested 1,000 websites in 2022 and found the average first-response time was 2 minutes and 40 seconds. That’s fast compared to email (where 12+ hours is common), but well above the sub-1-minute response that top-quartile teams deliver. The businesses that win on live chat are generally those who treat 2:40 as a ceiling, not a target.
16. Businesses that respond within 5 to 10 seconds achieve a CSAT rate of 84.7%.
Speed at this level requires either very low concurrent chat volume or well-staffed, well-trained agents. The CSAT payoff is real: responding in under 10 seconds pushes satisfaction nearly 12 points above the average benchmark. For high-volume businesses, this is the case for investing in dedicated live chat staffing rather than spreading agents across multiple channels simultaneously.
17. 21% of companies never reply to live chat inquiries at all.
SuperOffice’s 1,000-website study found that more than 1 in 5 companies with a live chat widget simply never responded. This is arguably the most damaging stat in live chat research: a chat widget that doesn’t get answered is worse than no chat widget at all. It creates an expectation and then fails it, directly.
18. 55% of companies send chat transcripts to customers after a conversation.
SuperOffice’s research also found that just over half of businesses send post-chat transcripts. This is both a quality signal (it shows you stand behind the interaction) and a practical tool for customers who need to reference the information later. For teams managing complex support issues, the transcript rate is a simple operational quality indicator.
19. The average handle time (AHT) for live chat in a contact center environment is 10 minutes.
AHT of 10 minutes accounts for the full interaction: initial greeting, problem diagnosis, resolution or escalation, and wrap-up. This is longer than many people expect for chat, but it reflects real contact center complexity. Simple transactional chats (order status, FAQs) resolve in 2 to 4 minutes. Billing disputes or technical issues stretch to 15 minutes or more. AHT is meaningful only when segmented by issue type.
Live Chat Agent Performance Benchmarks
These metrics are the ones operations teams actually use to staff, schedule, and evaluate live chat programs. If you’re building a chat team or benchmarking an existing one, these numbers give you a grounded starting point.
20. The average live chat agent handles 29 chats per day.
Tidio’s platform data across 2 million+ conversations puts average daily throughput at 29 chats per agent. That’s roughly one new chat every 16 minutes across an 8-hour shift, accounting for AHT and between-chat admin time. For a team outsourcing live chat, this figure is critical for headcount planning: it tells you how many agents you need for a given volume.
21. Chat agents can effectively handle 3 to 5 concurrent conversations.
Tidio’s research sets the concurrency range at 3 to 5 simultaneous chats for a trained agent. Below 3, you’re underusing capacity. Above 5, quality degrades and CSAT drops. This is why the 29 chats-per-day figure makes sense: at 3-5 concurrent and 2-4 minutes per resolution for simple queries, an agent can move through significant volume without the quality erosion you’d see at higher concurrency. Digital Minds BPO typically targets the 3-4 concurrent range for new agents and adjusts upward after 60 days based on CSAT and AHT data.
22. Chat support teams handle approximately 30 to 50 customer queries per day, with the higher end typical for text-heavy, FAQ-type inquiries.
The 30-50 range reflects natural variance by industry and issue complexity. A team handling ecommerce order inquiries will trend toward 50. A team managing software onboarding issues will trend toward 30. Both are healthy. The benchmark is less about hitting a number and more about maintaining CSAT within it.
23. Customer satisfaction rating is the most important performance metric for live chat agents and managers.
Beyond throughput, CSAT is what experienced chat operations managers watch most closely. It surfaces training gaps, identifies agents who over-rely on canned responses, and flags process breakdowns that speed metrics alone can’t detect. First contact resolution (FCR) and abandon rate round out the core three.
24. 53% of businesses report that live chat enables agents to resolve multiple concerns in a single interaction.
The ability to address more than one issue per session is a genuine efficiency advantage over phone, where call handling protocols often limit agents to single-issue resolution. In a well-run chat environment, agents can address a billing question, check an order status, and process a refund in one conversation, reducing repeat contact rates and improving FCR scores.
25. 69% of companies use canned responses to speed up common inquiries.
Canned responses are a practical necessity at volume, but the data is clear about their limits: customers find scripted answers frustrating when used for anything beyond true FAQs. The best teams use them as a starting template, then personalize before sending. The 35% frustration rate for scripted responses (Kayako, stat #12) is the direct cost of using canned responses too broadly.
Live Chat Sales, Conversion, and ROI Statistics
Live chat’s ROI case is stronger than most businesses realize. The numbers below cover purchase lift, conversion rate improvement, and order value impact. For anyone evaluating whether live chat investment pays off, the data answers the question directly. Check out our guide on the 16 key benefits of live chat for ecommerce for the full business case.
26. Customers who engage with live chat are 513% more likely to complete a purchase than those who don’t.
Kayako’s consumer survey produced one of the most cited stats in live chat research: a 513% lift in purchase likelihood for customers who use chat compared to those who don’t. This number is often questioned because of its size, but the mechanism is straightforward. Chat catches customers at the moment of hesitation (the question before checkout) and resolves it in real time. That’s conversion optimization, not magic.
27. Live chat produces a 20% average conversion rate increase for businesses that implement it.
Invesp’s industry-wide analysis puts the average conversion lift at 20% for businesses adding live chat to their digital presence. The lift is highest for businesses with complex products or long purchase cycles, where customers have genuine pre-purchase questions that email response times can’t answer fast enough to capture the sale.
28. Customers who use live chat spend 60% more per purchase than those who don’t.
Invesp’s data shows that the average order value for chat-engaged customers is 60% higher than for non-chat customers. The explanation is partly selection bias (customers with larger carts have more pre-purchase questions), but also reflects the upsell and cross-sell potential that a real-time conversation creates. An agent who helps a customer solve a problem has an earned credibility that product recommendation emails don’t.
29. 63% of customers who engage with live chat say they are more likely to return to that website.
Invesp found that repeat purchase intent jumps sharply when customers have had a positive chat experience. This tracks with Kayako’s finding that 52% of customers become more loyal to a business simply because it offers live chat. The channel drives retention beyond the immediate transaction.
30. 52% of customers report higher loyalty to companies that offer live chat support.
Kayako’s loyalty data stands apart from the satisfaction statistics because it captures long-term behavior, not just immediate reaction. More than half of customers surveyed said live chat availability directly influenced their loyalty. For subscription businesses or any model where customer lifetime value compounds over time, this number has direct revenue implications.
31. 63% of high-spending customers say they are loyal to companies that offer live chat.
Kayako segmented loyalty by spend level and found that the relationship between live chat and loyalty is even stronger among high-value customers. The implication is that live chat investment disproportionately retains your best customers, not just average spenders. That’s a significant ROI argument when calculating the cost of chat staffing against customer lifetime value.
32. 62% of companies report that live chat directly drives sales increases.
This isn’t just a customer-side perception. More than 6 in 10 businesses with live chat report measurable sales impact. The channel works as both a pre-purchase conversion tool and a post-purchase retention mechanism. Companies that see the strongest results tend to staff chat proactively, reaching out to visitors on high-intent pages rather than waiting for the visitor to initiate.
33. 38% of customers report that live chat helped them complete a website purchase they were about to abandon.
Over a third of chat users credit the channel with recovering a purchase they were about to leave behind. This is the cart abandonment use case that drives a lot of live chat ROI calculations. Proactive chat triggers on cart pages, timed to activate after 90 seconds of inactivity, are the most common implementation for capturing these moments.
Live Chat vs Other Channels: Cost-Per-Interaction Comparison
Cost-per-interaction data is where the outsourcing argument for live chat becomes concrete. The table below pulls together channel cost estimates alongside CSAT and response time benchmarks to give you a side-by-side view. Phone support costs several times more per interaction and delivers lower satisfaction scores, which is why businesses with high contact volume increasingly move routine inquiries to chat.
| Channel | Cost per interaction | CSAT benchmark | Avg. first response time |
|---|---|---|---|
| Live chat | $1 to $3 | 73% (Kayako) | 2 min 40 sec (SuperOffice) |
| Email support | $2.50 to $5 | 61% (Kayako) | 12+ hours (industry) |
| Phone support | $6 to $12 | 44% (Kayako) | 30+ sec queue wait |

Cost-per-interaction ranges are industry-wide estimates per Invesp. Actual figures vary by industry, team size, and agent location.
34. Live chat costs between $1 and $3 per interaction, compared to $6 to $12 for phone support.
The cost differential is driven by agent concurrency. A phone agent handles one call at a time. A chat agent handles 3 to 5 conversations simultaneously. That concurrency multiplier is why chat delivers better unit economics even before you account for the CSAT advantage. For businesses evaluating the best live chat outsourcing companies, this cost-per-interaction gap is often the starting point for the ROI conversation.
The word-of-mouth effect runs in both directions. While 29% of customers share negative experiences (Kayako, stat #13), more than 8 in 10 share positive ones. A well-run chat program doesn’t just reduce churn: it generates organic referrals. For businesses where word-of-mouth drives a meaningful share of acquisition, this is a cost-of-acquisition argument as much as a customer experience one.
36. 60% of customers are more likely to make a repeat purchase from a website that offers live chat support.
This repeat purchase rate (Invesp) closes the ROI loop: chat reduces cost-per-interaction, increases first-purchase conversion, and lifts repeat purchase rates. Considered together, these three effects can fundamentally change the unit economics of a customer service operation. Compare your current channel costs against SMS vs email statistics to build out a full channel cost picture.
Human Agent vs Chatbot Statistics
The chatbot vs human agent question has a straightforward answer in the data: both have a role, but they serve different tiers of inquiry. The most effective live chat programs use chatbots for Tier 1 (FAQs, order status, basic account queries) and route Tier 2+ (billing disputes, complaints, complex product questions) to human agents.
37. Websites using chatbots resolve 89.2% of inquiries, compared to 71.2% without chatbot assistance.
Smartsupp’s 2024 platform analysis found an 18-point resolution rate gap between sites with chatbot support and those relying on human-only chat. That’s a significant operational lift, particularly for high-volume programs where overnight or weekend coverage is otherwise a staffing challenge. The key word is “assistance”: the chatbot handles first contact and FAQ resolution; human agents take over when the query requires judgment.
38. 67% of customers prefer to resolve basic issues through self-service rather than speaking with an agent.
Two thirds of customers would rather find the answer themselves than wait for a human response. This preference makes a well-designed chatbot or knowledge base a customer experience investment, not a cost-cutting shortcut. The critical design principle: self-service should resolve the easy issues quickly and escalate the hard ones to a human without friction.
39. Chatbot-assisted live chat is projected to achieve a 4% lead generation conversion rate.
For inbound lead capture, a 4% conversion rate from chat interactions is a meaningful pipeline contributor. The chatbot handles qualification questions (company size, budget, timeline), captures contact information, and routes qualified leads to a human for follow-up. This hybrid model is particularly effective for B2B businesses with longer sales cycles.
40. 95% of customers say quality of support matters more than speed, but 84% still abandon a chat session when frustrated.
Kayako’s consumer data captures a real tension: customers say they value quality above speed, but their behavior when quality fails (scripted responses, lack of empathy, unresolved issues) is to leave quickly. The practical implication is that quality and speed aren’t a tradeoff: you need both. Speed gets customers into the conversation; quality keeps them there long enough to resolve the issue.
41. 0.84% of all website visitors initiate a live chat session, based on analysis of 4.8 billion site visits.
Smartsupp’s platform-wide data puts chat initiation at less than 1% of all visitors. This figure is useful for volume planning: if you have 100,000 monthly website visitors, you’re looking at roughly 840 chat sessions per month as a baseline. Proactive chat triggers typically lift this rate to 1.5-2% by reaching visitors who wouldn’t have initiated on their own.
Live Chat Market Size and Adoption Statistics
The live chat software market has moved from a niche customer support tool to a mainstream business infrastructure category. The adoption and market size data below reflects how broad that shift has become.
42. The global live chat software market is projected to reach $1.7 billion by 2030, growing at an 8.8% CAGR.
Allied Market Research’s market sizing puts the 2030 figure at $1.7 billion, with the 8.8% compound annual growth rate reflecting sustained enterprise adoption and SMB market penetration. The growth is driven by ecommerce expansion, increased customer experience investment, and the maturation of AI-assisted chat tools that make deployment easier at smaller scale.
43. There are now over 175,000 active live chat installations tracked on Smartsupp’s platform alone.
Smartsupp’s 2024 platform data covers 175,000+ active accounts, representing one of the largest single-platform datasets in live chat research. When you add the customer bases of Tidio, Intercom, LiveChat, Zendesk, and other platforms, the total installed base runs into the millions of business accounts globally. The best live chat apps are reviewed in our guide to the best live chat apps and software.
44. 42% of US online adults now consider live chat an important website feature, up from 27% in 2019.

Forrester’s tracking data shows this 15-point jump across a three-year period. The consistent upward trend suggests live chat importance will continue climbing as digital-native consumers age into their primary spending years. Businesses building their customer support infrastructure now are investing ahead of an expectation that will be standard within five years.
45. Data security remains a top concern for live chat users, with customers more cautious about sharing sensitive information over chat than over phone.
Despite strong satisfaction scores, live chat faces a persistent trust gap around data sensitivity. Customers share account numbers and personal details over phone more readily than over chat because the chat record creates a visible text trail. Businesses that invest in end-to-end encryption and clear data handling disclosures see higher willingness to engage on sensitive topics. This is an area where chat program design directly affects resolution rates.
Methodology and Sources
The statistics in this post were sourced from primary research studies and platform data published by the organizations listed below. We prioritized studies with documented methodology, named sample sizes, and verifiable publication dates. Where studies use different methodologies or produce different results for the same metric, we’ve noted the source and context so you can judge which figure best applies to your situation.
- Kayako: Consumer survey of 1,000+ US adults on live chat preferences, satisfaction, loyalty, and frustration drivers. Available at kayako.com.
- SuperOffice: Original research testing 1,000 live business websites for response time, reply rates, and transcript practices (October 2022). Available at superoffice.com.
- Smartsupp: Platform data from 175,000+ active accounts and analysis of 4.8 billion website visits, published February 2024. Available at smartsupp.com.
- Tidio: Proprietary platform data from 2 million+ conversations, published February 2026. Available at tidio.com.
- Forrester Research: State of Chat in Retail, May 2021. Available at forrester.com.
- Allied Market Research: Live chat software market sizing and CAGR projection. Available at alliedmarketresearch.com.
- Invesp: Industry-wide aggregated data on live chat conversion, cost, and retention metrics (October 2023). Available at invespcro.com. Note: Invesp aggregates data from multiple primary sources; these figures are labeled as industry-wide estimates throughout.
- McKinsey: Digital channel preference research referenced for Gen Z behavior patterns. Available at mckinsey.com.
Year references in this post reflect data publication dates. Historical statistics from 2021-2023 studies are retained where no more current primary source is available and the trend direction is confirmed by newer data.
Frequently Asked Questions About Live Chat Statistics
What percentage of customers prefer live chat over phone?
According to Tidio’s 2026 platform data, 41% of customers prefer live chat as their primary real-time support channel. Kayako’s consumer survey supports this, showing live chat CSAT at 73% versus 44% for phone, a 29-point gap that reflects a genuine preference for chat’s speed and convenience. Forrester’s tracking data shows this preference has grown steadily from 27% in 2019, and the trend continues upward as digital-native consumers account for a larger share of active buyers.
What is a good live chat CSAT score?
A CSAT score of 75 or higher is the contact center industry benchmark for excellent live chat performance. Kayako’s consumer survey places the average live chat CSAT at 73%, and Tidio’s top-quartile benchmark is 87% positive CSAT for well-run programs. If your team is consistently below 75%, the most common causes are response times above 3 minutes, over-reliance on scripted responses, and agents handling more than 5 concurrent chats. All three are addressable through training and staffing adjustments.
How fast should a live chat response be?
SuperOffice’s 2022 study of 1,000 business websites found the industry average first-response time is 2 minutes and 40 seconds. Best-in-class teams respond within 60 seconds. Businesses that respond within 5 to 10 seconds achieve a CSAT rate of 84.7%, compared to the 73% average for standard response times. The practical target for most teams is under 1 minute for first response, with full resolution within 10 minutes for standard inquiries.
How many chats can one agent handle at the same time?
Tidio’s platform research sets the effective concurrency range at 3 to 5 simultaneous conversations. Below 3, you’re underutilizing agent capacity. Above 5, response quality and CSAT both decline measurably. At Digital Minds BPO, we typically start new chat agents at 3 concurrent conversations and adjust to 4-5 after 60 days based on their CSAT scores and AHT data. Jumping straight to 5 concurrent with an untrained agent is a reliable path to a poor CSAT score.
Does live chat increase sales and conversions?
The data is clear on this. Kayako’s consumer research found that customers who engage with live chat are 513% more likely to complete a purchase than those who don’t. Invesp’s industry-wide analysis puts the average conversion rate increase at 20% for businesses that implement live chat, with chat-engaged customers spending 60% more per purchase. The ROI is strongest for businesses with complex products, long purchase cycles, or high cart abandonment rates. Explore the full conversion case in our guide on how live chat drives ecommerce revenue.
Should I use chatbots or human agents for live chat?
Both, at different tiers. Smartsupp’s 2024 platform data shows websites with chatbot assistance resolve 89.2% of inquiries, compared to 71.2% without. The effective model is: chatbots handle Tier 1 (FAQs, order status, account lookups), and human agents handle Tier 2+ (billing disputes, complex product questions, complaints requiring judgment). Sixty-seven percent of customers prefer to resolve basic issues through self-service, so a well-designed chatbot actually improves satisfaction for simple queries. The failure mode is routing complex issues to a chatbot that can’t resolve them, which is where the 84% abandonment rate (Kayako) is most likely to occur.
What These Live Chat Statistics Mean for Your Business
The data across these 45 statistics points in one direction: live chat is the highest-ROI customer service channel available to most businesses in 2026. It delivers higher CSAT than phone and email, costs less per interaction, increases conversion rates, and drives repeat purchase behavior. The gap between a well-run chat program and a poorly staffed one is large, but it’s measurable and closeable.
The businesses that get the most from live chat share a few traits. They staff to keep response times under 60 seconds. They train agents to use canned responses as starting points, not final answers. They route complex issues to dedicated agents rather than spreading chat across a team handling other channels simultaneously. And they measure CSAT at the conversation level, not just in aggregate.
Digital Minds BPO has been running live chat programs for clients across ecommerce, SaaS, healthcare, and professional services since 2010. Our teams are trained specifically for chat concurrency management, and our CSAT monitoring is built into every engagement from day one. If you’re weighing whether to build a chat team in-house or outsource live chat support to a dedicated provider, the cost-per-interaction data in this post is a reasonable starting point for that conversation. See how we compare to other options in our overview of the 5 best live chat outsourcing companies for 2026.

Charvel Rebagay is the CEO and Founder of Digital Minds BPO, a Philippines-based outsourcing company he established in 2010. Based in Naga City, he works directly with clients and teams daily to ensure service quality across every engagement. With over 15 years of experience building and managing dedicated teams for businesses worldwide, Charvel has helped hundreds of companies scale their operations through skilled Filipino professionals. Under his leadership, Digital Minds BPO operates 3 dedicated facilities with a 94% client retention rate, serving Fortune 500 clients including P&G and Petron.