These 62 prior authorization statistics for 2026 each name the publisher, the edition or data year, and the sample wherever the source discloses one. They cover Medicare Advantage volumes, payer-posted denial and appeal rates, decision times, the American Medical Association (AMA) physician survey, and cost. A final section lists the widely repeated figures that are stale or untraced.
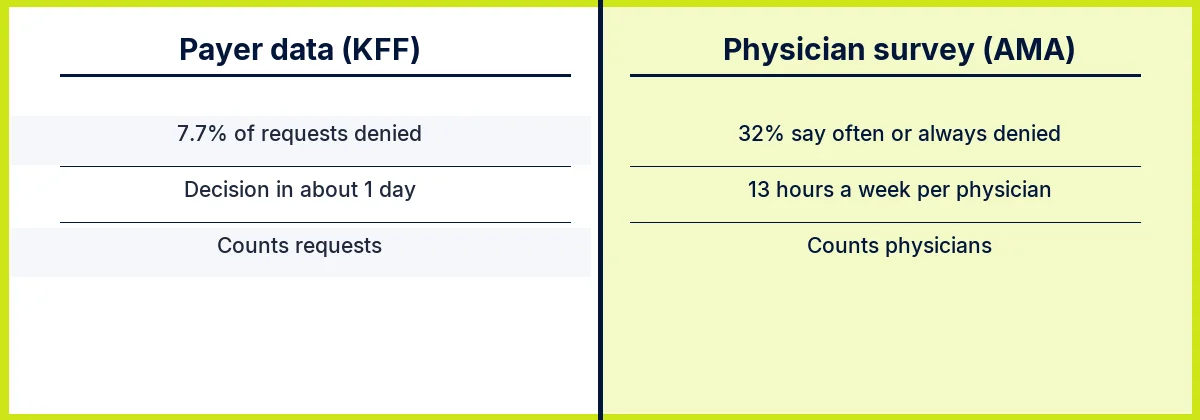
The central finding is that payer data and physician surveys can both be accurate and still look contradictory. KFF’s January 2026 analysis of CMS data shows Medicare Advantage insurers fully or partly denied 7.7% of 52.8 million prior authorization determinations in 2024. The AMA’s survey of 1,000 physicians, fielded in December 2025, found 32% say prior authorization requests are often or always denied. One figure counts requests; the other counts physicians describing their experience.
Digital Minds BPO, a business process outsourcing company in Naga City, Philippines, compiled this list from published sources and holds no proprietary prior authorization data. Nothing below describes the company’s own results.
How These Prior Authorization Statistics Were Sourced
Prior authorization is a payer’s advance approval of a service or drug before it is delivered. A prior authorization denial is a payer declining that approval. A claim denial, or in HHS Office of Inspector General (OIG) language a payment denial, happens later, when a payer declines to pay for care already delivered. The two are counted differently, and this post keeps them apart in every sentence. For scale, KFF’s ACA Marketplace claims analysis found 20% of in-network claims denied in 2023; that is a claims figure and appears nowhere else here as a prior authorization rate.
The sources fall into three kinds. Payer-reported data comes from CMS reporting and insurer websites, analyzed by KFF in its August 2026 review of 14 insurers’ posted metrics and published under the CMS-0057-F final rule. Physician-reported data comes from the AMA survey and from Sahni and colleagues in Health Affairs Scholar (2024), which surveyed 1,005 patients, 1,010 provider employees, and 115 private payer employees between April 21 and June 16, 2023. Audit data comes from the OIG’s 2022 review of sampled Medicare Advantage denials.
Each measure counts once toward the 62. A comparison pair, a range across insurers, or a breakdown by year, coverage type, or survey answer is one statistic. Neither the audit section’s repeated figures nor the claims figure above is counted. The link sits on the first mention of each source, and later mentions are text-only.
Editions need care. The AMA publishes its survey PDF at one address and replaces the file each year, so this post cites each edition by the month it was fielded: December 2025 for the PDF, and late 2024 for the AMA’s article of April 24, 2025. The AMA survey also screened physicians who complete prior authorizations in a typical week, so its percentages describe physicians who handle the work, not all physicians. Digital Minds BPO offers healthcare BPO services and so has a commercial interest in the staffing questions that follow.
Key Prior Authorization Statistics for 2026
- KFF, CMS data for 2024: Medicare Advantage insurers made 52.8 million prior authorization determinations, and 7.7% were fully or partly denied.
- KFF, 2024: 11.5% of Medicare Advantage denials were appealed, and 80.7% of appeals were partly or fully overturned.
- KFF, insurer-posted 2025 data: standard-request denial rates of 12% in Medicare Advantage, 14% in Medicaid managed care, and 18% in ACA Marketplace plans.
- KFF, 2025 data: median standard decision time of about 1 day in Medicare Advantage and Medicaid managed care, and about 0.9 days in ACA plans.
- AMA, December 2025: physicians report 40 prior authorizations a week each, taking 13 hours; 95% report care delays.
- AMA, December 2025: 26% report a serious adverse event for a patient, and 32% say requests are often or always denied.
- OIG, 2022: 13% of sampled Medicare Advantage prior authorization denials met Medicare coverage rules.
- CMS-0057-F: decisions within 72 hours for expedited and 7 calendar days for standard requests (Qualified Health Plan issuers on the federally facilitated exchanges excepted), with the first public metrics due March 31, 2026.
Prior Authorization Volume in Medicare Advantage, 2019 to 2024
KFF’s analysis, published January 28, 2026, counted 52.8 million determinations in 2024, up from 49.8 million in 2023. Requests per enrollee were 1.7 in 2024 and 1.8 in 2023. Of the 2024 total, 48.7 million (more than 90%) were fully favorable to the enrollee.
| Year | Determinations | Requests per enrollee |
|---|---|---|
| 2019 | Not quoted here | About 1.7 |
| 2020 | Not quoted here | 1.4 |
| 2021 | Not quoted here | 1.5 |
| 2022 | Not quoted here | Not quoted here |
| 2023 | 49.8 million | 1.8 |
| 2024 | 52.8 million | 1.7 |
Source: KFF, January 28, 2026, analysis of CMS data. “Not quoted here” marks a year for which this post cites no figure.
Insurers differ more than years do. Requests per enrollee ranged from 0.6 at Kaiser to 3.0 at Elevance and Centene in 2024. The total rose between 2023 and 2024 while the per-enrollee rate slipped from 1.8 to 1.7. On KFF’s rounded figures, that points to enrollment growth rather than heavier use per member; the reading is our arithmetic and not a KFF finding.
KFF lists the data limits. CMS reports at the contract level, insurers under 1 million enrollees are grouped, and CMS expects to expand detailed reporting to all plans in 2027.
Prior Authorization Denial Rates by Coverage Type
The prior authorization denial rate depends on the coverage type, the data year, and whether a partial denial counts. In the CMS data, KFF found 4.1 million Medicare Advantage requests (7.7%) fully or partly denied in 2024, against 6.4% in 2023 and 7.4% in 2022. Of those denials, 73% were full denials. By insurer, the 2024 denial rate ran from 4.2% at Elevance to 12.8% at UnitedHealth Group.
Insurer-posted 2025 data gives a three-way comparison. KFF’s August 13, 2026, review covered 14 insurers and put denial rates for standard requests at 12% in Medicare Advantage, 14% in Medicaid managed care, and 18% in ACA Marketplace plans.
| Coverage type (2025 posted data) | Standard denial rate | Expedited denial rate | Insurer range (standard) |
|---|---|---|---|
| Medicare Advantage | 12% | 10% | 5% to 17% |
| Medicaid managed care | 14% | 12% | 2% to 23% |
| ACA Marketplace | 18% | 16% | 3% to 25% |

Source: KFF, August 13, 2026, 14 insurers. Figures are as posted by insurers, which report percentages rather than counts.
The same review reports approval rates of 82% to 90% across those postings. A KFF Quick Take from April 2, 2026, adds UnitedHealthcare’s own reported approvals: about 80% on HealthCare.gov plans, nearly 92% in Medicaid and CHIP, and 95% in Medicare Advantage.
The OIG asked a different question: whether the denials were correct. Its 2022 review covered 250 prior authorization denials and 250 payment denials from 15 of the largest Medicare Advantage organizations during June 1 to 7, 2019. It found 13% of the prior authorization denials met Medicare coverage rules, and 18% of the payment denials met both coverage and billing rules. The two percentages describe separate denial types and should not be added.
Appeals and Overturn Rates
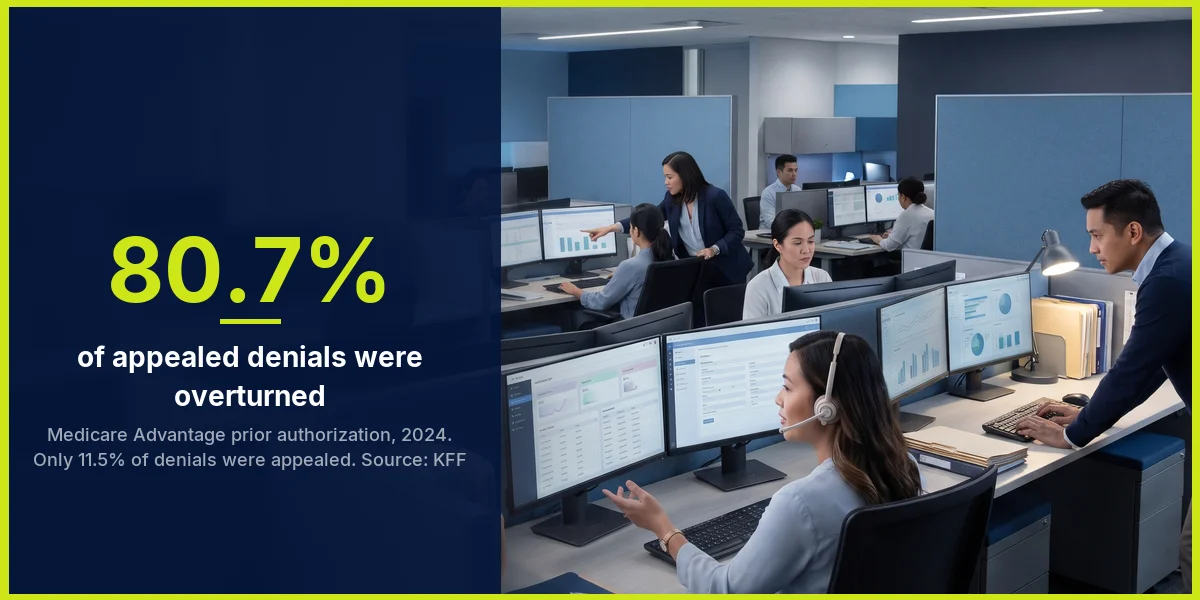
Few denials are appealed, and most appeals that are filed succeed. KFF found 11.5% of Medicare Advantage prior authorization denials were appealed in 2024, against 11.7% in 2023 and 7.5% in 2019. Of the 2024 appeals, 80.7% were partly or fully overturned, and more than 8 in 10 were overturned in every year from 2019 to 2024.
Insurers vary widely. The appeal share of denials ran from 1.6% at Kaiser to 19.9% at CVS, and the overturn rate ran from 51.0% at Kaiser to 95.5% at Centene. For comparison, traditional Medicare saw 6.4% of denials appealed in 2022.
| Data set | Coverage type | Appeals overturned |
|---|---|---|
| CMS data, 2024 | Medicare Advantage | 80.7% (partly or fully) |
| Insurer-posted, 2025 (standard requests) | Medicare Advantage | 67% |
| Insurer-posted, 2025 (standard requests) | Medicaid managed care | 47% |
| Insurer-posted, 2025 (standard requests) | ACA Marketplace | 43% |
Source: KFF, January 28, 2026, and August 13, 2026. The two data sets differ in year, source, and counting method; see the reconciliation section below.
One narrower report sits behind the widely repeated claim that nearly all appealed denials are overturned. The OIG’s June 8, 2026, report covers skilled nursing facility (SNF) admissions only. Nineteen Medicare Advantage organizations denied 12% of SNF admission requests in June 2024, 18% of those denials were appealed, and 95% of the appealed denials were overturned.
Prior Authorization Turnaround Time
Insurer-posted medians put the prior authorization turnaround time near one day for standard requests. Patients, providers, and payers describe the delays differently, and the table lines the main readings up.
| Source, year | Measure | Figure |
|---|---|---|
| KFF, insurer-posted 2025 data | Median decision time, standard requests | About 1 day (Medicare Advantage and Medicaid managed care), about 0.9 days (ACA) |
| KFF, insurer-posted 2025 data | Median decision time, expedited requests | About 0.4 days (Medicare Advantage), 0.8 (Medicaid managed care), 1 (ACA) |
| Sahni et al., fielded April to June 2023 | Share saying approvals take more than 5 days | 37% of patients, 27% of providers, 15% of payers |
| CMS-0057-F, effective generally January 1, 2026 | Maximum decision time | 72 hours (expedited), 7 calendar days (standard) |
Figures are as published. The CMS limits exclude Qualified Health Plan issuers on the federally facilitated exchanges and exclude drugs.
Medians hide the slow cases. KFF notes the posted data reports medians only, with no share of requests that exceeded the deadline, and that insurers mix hours and days. A one-day median is compatible with a long tail.
For medications, no CMS-0057-F clock applies, because the rule excludes drugs, and none of the sources cited here gives a national turnaround figure for drug requests.
Prior Authorization Burden: AMA Physician Survey Results
The AMA’s December 2025 edition surveyed 1,000 practicing physicians from the Medscape panel, 40% in primary care and 60% in specialties, using a 44-question web survey. The AMA’s own write-up of the late-2024 edition, “Fixing prior auth: Nearly 40 prior authorizations a week is way too many” (April 24, 2025), also covers 1,000 physicians. The table sets the two editions side by side. The 2022 edition is in the audit section below, labeled as reported by a third party.
| Measure | December 2025 edition | Late-2024 edition |
|---|---|---|
| Prior authorizations per physician per week | 40 | 39 |
| Hours per week on prior authorization | 13 | 13 |
| Physicians with staff working exclusively on prior authorization | 40% | 40% |
| Say prior authorization somewhat or significantly increases physician burnout | 94% | 89% |
| Report higher utilization of care | 88% | 88% |
| Serious adverse event for a patient | 26% | More than one-quarter |
| Hospitalization | 20% | 23% |
| Life-threatening event or intervention to prevent permanent damage | 22% | 18% |
| Disability, permanent damage, or death (birth defect also listed in 2025) | 8% | 8% |
Sources: AMA prior authorization physician survey PDF (fielded December 2025) and AMA article of April 24, 2025 (late-2024 survey). The AMA lists the event categories with the serious adverse event figure; they are shown as published and are not added up.

The December 2025 edition adds findings the 2024 article does not quote. Care delays were reported by 95% of physicians (always 13%, often 42%, sometimes 40%), and 79% said patients at least sometimes abandon treatment. In the same edition, 92% reported a negative effect on clinical outcomes, 32% said requests are often or always denied, and 74% said denials have increased over five years.
Few physicians appeal every denial. Only 21% always appeal; among those who do not, 59% say the appeal will not succeed, 52% cite a lack of staff time, and 49% say the care cannot wait. Separately, 35% say prior authorization criteria are rarely or never evidence-based, and just 24% agree medical-necessity denials are reviewed by a qualified clinician.
Physician sentiment toward reform is cautious. Only 33% think the June 23, 2025, pledge by more than 60 insurers will make a meaningful difference. And 60% are concerned that AI will increase denial rates; this is a physician concern reported by the AMA, not a measured outcome. Electronic submission is not yet standard in practice either: 24% say their EHR offers electronic prior authorization for drugs, and phone is the most common method for medical-services requests.
| Rated high or extremely high burden | Share of physicians, December 2025 |
|---|---|
| By insurer | UnitedHealthcare 75%, Humana 65%, Anthem/Elevance 61%, Aetna 61%, Cigna 59%, Blue Cross Blue Shield 56% |
| By coverage type | Medicare Advantage 69%, commercial 63%, Medicaid 62%, traditional Medicare 47% |
Source: AMA survey PDF, fielded December 2025. These are physician ratings, not payer performance measures.
Sahni and colleagues surveyed all three sides in 2023. Among providers, 92% said prior authorization delayed care. Only 2% of providers said it was no burden, against 34% of patients and 7% of payers. On burnout, 42% of providers and 13% of payers rated prior authorization a high contributor.
Patients report it too. A KFF poll cited in the April 2026 Quick Take, which does not give the poll’s date, found that four in 10 insured adults with a chronic condition call prior authorization their single biggest burden beyond costs. Many of the tasks behind these burden figures are administrative: gathering records, calling payers, and tracking each request. That follow-up is the work a virtual medical assistant can take on.
The Cost of Prior Authorization
Direct cost figures for prior authorization are scarce and mostly modeled. The Sahni 2024 paper cites a “$35 billion” figure for administrative spending, attributing it to a 2021 JAMA article by Sahni, Carrus, and Cutler and to 2021 McKinsey work. It is a modeled estimate carried forward from those papers; the survey did not measure it.
Per-submission costs come from Sahni and colleagues in Health Affairs Scholar (2023): an estimated $40 to $50 per submission for private payers and $20 to $30 for providers. The method sits in a technical appendix, so treat the numbers as estimates.
Electronic adoption is the one cost-related measure here with two comparable years of data. CAQH Index data, as reported by X12 on August 17, 2026, shows fully electronic prior authorization transactions growing between the 2024 and 2025 Index years while manual ones fell.
| Measure | 2024 Index | 2025 Index |
|---|---|---|
| Fully electronic transactions | 95 million (35%) | 102 million (38%) |
| Partly electronic transactions | 123 million (43%) | 126 million (46%) |
| Manual transactions | 54 million | 44 million |
| Cost avoided | $966 million | $1.2 billion |
Source: CAQH Index data as reported by X12. As of October 2026, the public CAQH Index page shows no prior authorization figures, so the X12 report is the cited source. Shares are shown as X12 reports them. On the 2024 counts, our arithmetic puts the partly electronic share nearer 45%.
The AMA’s time figures carry no measured dollar value: 13 hours a week per physician, and 40% of physicians with staff working exclusively on prior authorization. The widely repeated per-physician dollar figure is a single author’s extrapolation, traced in the audit section below. Practices weighing who should staff eligibility checks and denial follow-up can start with the guide to medical billing outsourcing and the medical billing services page.
Why Payer and Physician Prior Authorization Figures Disagree
One example shows the gap. KFF’s CMS data show UnitedHealth Group denying 12.8% of its Medicare Advantage prior authorization requests in 2024. UnitedHealthcare’s own 2025 posting shows about 95% Medicare Advantage approvals. Those figures differ by about 8 points on our arithmetic (100% minus 12.8% is 87.2%, against 95%), and neither is wrong on its face.
Five differences separate those two figures. The first is our observation; the other four draw on the gaps KFF’s August 2026 review lists in payer postings. Each can open a gap without anyone misreporting:
- Different years: the CMS figure covers 2024 and the posting covers 2025.
- Different units: postings give percentages, not counts, and CMS counts fully or partly denied requests.
- Different denominators: some ACA insurers report nationally, and the posting template is optional.
- Distortions: gold-card programs can raise approval rates, and case mix differs by insurer.
- Missing detail: no appeal totals, no breakdown by service or reason, and no share exceeding deadlines.

The survey side adds its own mismatch. When 32% of physicians say requests are often or always denied, that is a share of physicians describing frequency, not a share of requests. It can sit beside a 7.7% request-level denial rate without conflict. The AMA also reports that only 5% of respondents contract with plans offering gold-card exemptions, so few of them benefit from the programs KFF says can raise payer approval rates.
The cleanest evidence of the disagreement comes from a single data set. In Sahni and colleagues’ 2023 survey, the perceived approval rate was 88% for patients, 70% for providers, and 73% for payers. Three groups answering the same question in the same survey split by 18 points between patients and providers, which points to differences in what each group sees. That reading is our analysis; the paper reports the numbers.
CMS-0057-F: What Payers Must Publish and When
The CMS fact sheet of January 17, 2024, covers Medicare Advantage organizations, state Medicaid and CHIP fee-for-service programs, Medicaid managed care plans, CHIP managed care entities, and Qualified Health Plan issuers on the federally facilitated exchanges. Its requirements take effect on three dates.
| Date | Requirement |
|---|---|
| Generally January 1, 2026 | Operational provisions begin: 72-hour and 7-calendar-day decision limits (excluding QHP issuers on the federally facilitated exchanges) and a specific reason for each denial |
| March 31, 2026 | First set of annual public metrics due |
| Generally January 1, 2027 | Four application programming interfaces (APIs): Patient Access, Provider Access, Payer-to-Payer, and Prior Authorization |
Source: CMS fact sheet, January 17, 2024. Exact dates vary by payer type. The rule does not apply to prior authorization decisions for drugs.
The fact sheet does not list the metrics. KFF names one, the “overall average rate of denials.” The March 31 deadline has passed, and the first postings are the ones KFF analyzed in August 2026.
APIs are electronic plumbing; the people who assemble clinical documentation and chase statuses still decide what goes into each request. Reading a payer’s disclosure page means checking its data year, whether it reports counts or percentages, and whether partial denials are included.
Prior Authorization Figures That Are Stale or Untraced
Several figures circulate with no year attached. Repetition gives a number reach without adding evidence, so each is traced to its earliest source found. The pages that repeat them are not named.
The AMA reuses one PDF address every year. As of October 2026, the file at ama-assn.org/system/files/prior-authorization-survey.pdf serves the December 2025 edition, so any page that links it while quoting 45, 39, or 33% now points at different numbers. The AMA also rewrites articles in place: the “40-plus prior authorizations a week” address now redirects to “Nearly 40…”. Citing by title, date, and fielding month avoids both traps.
| Figure as repeated | Earliest source found | What later or primary sources show |
|---|---|---|
| 45 prior authorizations a week | AMA 2022 edition, as reported by the ASCO Post, April 10, 2023 | 39 (late 2024) and 40 (December 2025) |
| 14 hours a week | Same 2022 edition, as reported by the ASCO Post | 13 hours in both later editions |
| 35% employ dedicated prior authorization staff | Same 2022 edition, as reported by the ASCO Post | 40% in both later editions |
| One-third saw a serious adverse event | 33% in the 2022 edition, as reported by the ASCO Post | More than one-quarter (late 2024) and 26% (December 2025) |
| 94% report care delays | 2022 edition, as reported by the ASCO Post | 95% in December 2025. The December 2025 edition also has a 94% figure, but for burnout, a different measure |
| Nearly all appealed denials are overturned | OIG skilled nursing facility report, June 8, 2026: 95% | That report covers SNF admission only. KFF puts Medicare Advantage at 80.7% (2024), and insurer-posted 2025 rates run 43% to 67% |
| Approvals take 3 to 10 days | No study found; the closest match is a clinic FAQ page | Insurer-posted 2025 medians are about 1 day; medians hide the tail |
| About $11,000 a year per physician | Physicians Practice, August 22, 2023: $11,046.67, the author’s own extrapolation | A single-author calculation, not a measured cost |
| $35 billion in administrative spending | JAMA 2021 and McKinsey 2021, as cited by Sahni et al. (2024) | A modeled 2021 estimate that the 2024 survey paper carries forward |
The 2022 AMA figures are second-hand and appear here only for comparison.
Five of the nine figures above come from the 2022 AMA edition, and the later editions report a different number for every one of them. A reader who sees “45 a week” with no edition cannot tell it is three years behind.
Conclusion
Behind the burden figures in this post sits staff work: assembling clinical documentation, submitting requests, calling payers, tracking status, and preparing appeal packets. Digital Minds BPO provides office-based, HIPAA-trained teams in Naga City who handle that follow-up through its prior authorization services. Clinicians make the clinical calls and payers make the coverage decisions; nothing here predicts how a payer will rule.
Practices comparing front-office options can also read the company’s patient no-show statistics and its guide to HIPAA requirements for call centers. If your practice is weighing how to staff prior authorization work, the conversation starts on the prior authorization services page.
FAQ: Prior Authorization Statistics
The rate varies by coverage type and data year. KFF’s CMS data show 7.7% of Medicare Advantage requests fully or partly denied in 2024, and insurer-posted 2025 data show 12% (Medicare Advantage), 14% (Medicaid managed care), and 18% (ACA Marketplace) for standard requests. Most requests are approved: insurer-posted 2025 approval rates run 82% to 90%, and more than 90% of 2024 Medicare Advantage determinations were fully favorable.
Under CMS-0057-F, covered payers generally began on January 1, 2026, to give decisions within 72 hours for expedited and 7 calendar days for standard requests, and to state a specific reason for each denial. Qualified Health Plan issuers on the federally facilitated exchanges are exempt from the time limits. The first public metrics were due March 31, 2026, and the API requirements generally follow on January 1, 2027. Drugs are excluded from the rule.
KFF found 80.7% of appealed Medicare Advantage denials were partly or fully overturned in 2024, while insurer-posted 2025 rates for standard requests were 67% (Medicare Advantage), 47% (Medicaid managed care), and 43% (ACA Marketplace). Only 11.5% of Medicare Advantage denials were appealed in 2024.
None of the sources in this post gives a national figure for medications. CMS-0057-F’s 72-hour and 7-day limits do not apply to drugs, and the insurer-posted medians of about 1 day for standard requests are not broken out for drugs here.
The AMA’s December 2025 survey found 40 per physician per week, taking 13 hours, up from 39 per week in the late-2024 edition. The often-quoted 45 a week comes from the 2022 edition, as reported by the ASCO Post.

Sofia Reyes is a Content Writer and SEO Specialist at Digital Minds BPO, where she focuses on outsourcing-industry research and educational content for business decision-makers. Based in the Philippines, she has 7 years of experience writing B2B content across SEO, content strategy, and Generative Engine Optimization (GEO). Sofia partners with Digital Minds BPO’s operations and account management teams to translate 15+ years of frontline BPO experience into clear, sourced guides on call center, customer service, and back-office outsourcing. Her work supports prospects evaluating outsourcing decisions across the company’s three dedicated facilities, where the team delivers a 94% client retention rate for clients ranging from Fortune 500 enterprises to growth-stage businesses.