This post compiles 50+ customer service statistics for 2026, drawn from primary research by Zendesk, Gartner, Grand View Research, Qualtrics, and Salesforce.
The data below covers customer expectations, the true cost of poor service, how AI is reshaping frontline operations, channel preferences by contact type, outsourcing market growth, and the revenue case for investing in CX. Every stat cites its primary source by name.
Use this data to pressure-test your current service model, build the internal business case for change, or understand where your customers’ expectations are heading in 2026.
Key Takeaways
- Poor service is a $3.7 trillion problem globally. Qualtrics (2024) found 51% of consumers reduce or stop spending after a negative experience, and the cumulative revenue at risk grew 19% year over year.
- 88% of customers buy again after a great experience. Salesforce (2024) puts the repeat-purchase link squarely on service quality, not product quality alone.
- AI pressure is real but overstated. Gartner (2026) found 91% of CS leaders are under executive pressure to implement AI, yet only 20% have actually reduced agent headcount because of it.
- Live chat leads channel preference at 41%. HubSpot (2024) found phone is second at 32%, and 61% of customers prefer self-service for simple issues (Salesforce, 2025).
- The outsourcing market is accelerating. The global outsourced customer care market was $77.12B in 2024 and is projected to reach $113.18B by 2030, according to Grand View Research.
- Response speed is a loyalty trigger. 88% of consumers expect faster response times than a year ago (Zendesk, 2026), and 67% of customers drop calls out of frustration before reaching an agent.
Customer Expectations Statistics
Customer expectations have risen sharply over the past three years. The data shows that speed, personalization, and consistency are no longer differentiators: they are the baseline. Companies that meet them retain customers; those that miss them lose them fast.
88% of customers say good customer service makes them more likely to purchase again. According to Salesforce’s State of the AI Connected Customer (7th Ed., 2024), service quality ranks alongside product quality as a purchase driver. It’s one of the most replicated findings in CX research over the past decade.
86% of consumers are willing to pay more for a better customer experience. PwC’s Consumer Intelligence Series found this premium-for-service willingness holds across age groups, with younger consumers showing the highest price sensitivity to poor service.
74% of consumers expect customer service to be available 24/7, and 88% expect faster response times than a year ago, according to the Zendesk CX Trends 2026 report. Both figures are up year over year, which means the expectation baseline keeps moving.
85% of CX leaders say their service teams are now expected to contribute larger revenue share through upselling and retention work, per Salesforce (2024). Customer service has shifted from a cost center to a revenue function in how executives measure it.
83% of CX leaders say memory-rich AI agents are key to personalization, and 85% call personalized customer journeys critical to business outcomes (Zendesk CX Trends 2026). Customers want to be recognized across interactions, not re-explain their situation every time they contact support.
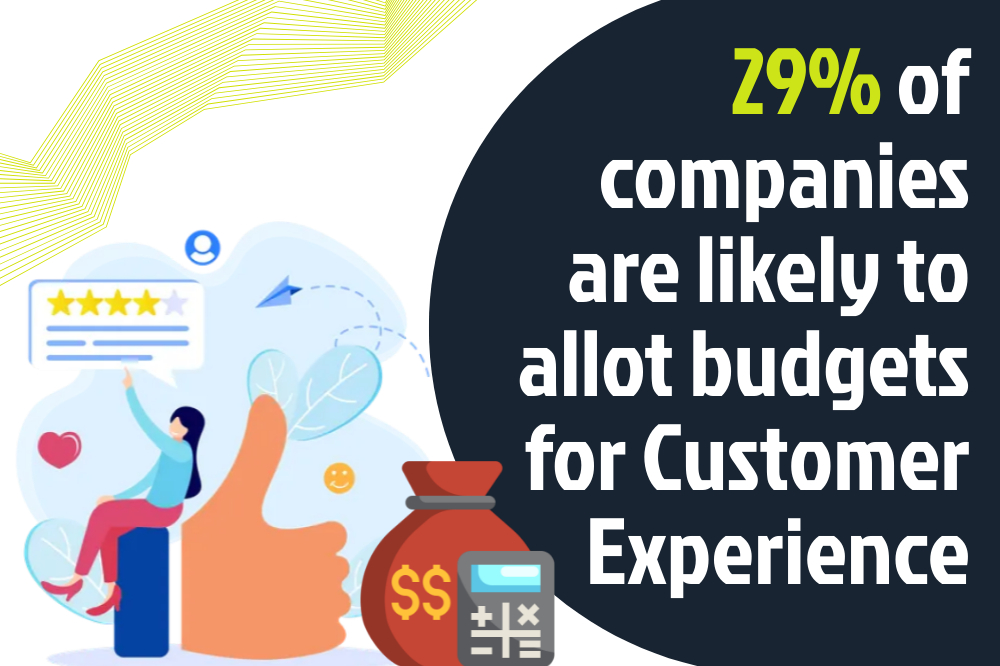
29% of companies are actively allocating dedicated budgets for CX improvements. Companies that prioritize customer satisfaction alongside growth and profitability targets show higher customer success rates. Budget allocation is a leading indicator of how seriously a company treats the function.
95% of consumers expect an explanation when AI makes a decision affecting their service, yet only 37% of organizations provide any form of reasoning (Zendesk CX Trends 2026). The gap between what customers expect from AI and what companies actually deliver is one of the defining CX challenges of 2026.
67% of customers expect support tickets resolved within 3 hours, according to HubSpot’s State of Customer Service (2024). For voice channels, that resolution window is even shorter. For teams running without dedicated overnight coverage, this statistic is a direct challenge to their service model.
For more context on what exceptional service looks like in practice, see our guide on what exceptional customer service actually looks like.
Customer Service ROI Statistics
The business case for investing in customer service is better documented now than at any point in the past decade. These figures cover retention economics, revenue impact, and the long-term compounding effect of serving customers well.


Increasing customer retention by just 5% increases profits by 25% to 95%. This finding, from the Reichheld/Bain research published in the Harvard Business Review, remains one of the most cited statistics in all of customer service research. Retention economics reward companies that keep customers, not just acquire them.
93% of customers said they are willing to repeat a purchase from a company that offers a positive service experience. Loyalty is built in the moments after the sale, not just during it. Every support interaction is either strengthening or weakening that likelihood.

83% of consumers say they trust and stay loyal to companies that respond promptly and help resolve their issues. Responsiveness is the single most consistent loyalty driver across channel types, industry sectors, and customer age groups.
86% of respondents say great customer service experiences can turn one-time buyers into loyal customers. A first purchase is a test. The post-purchase support experience determines whether it becomes a relationship.
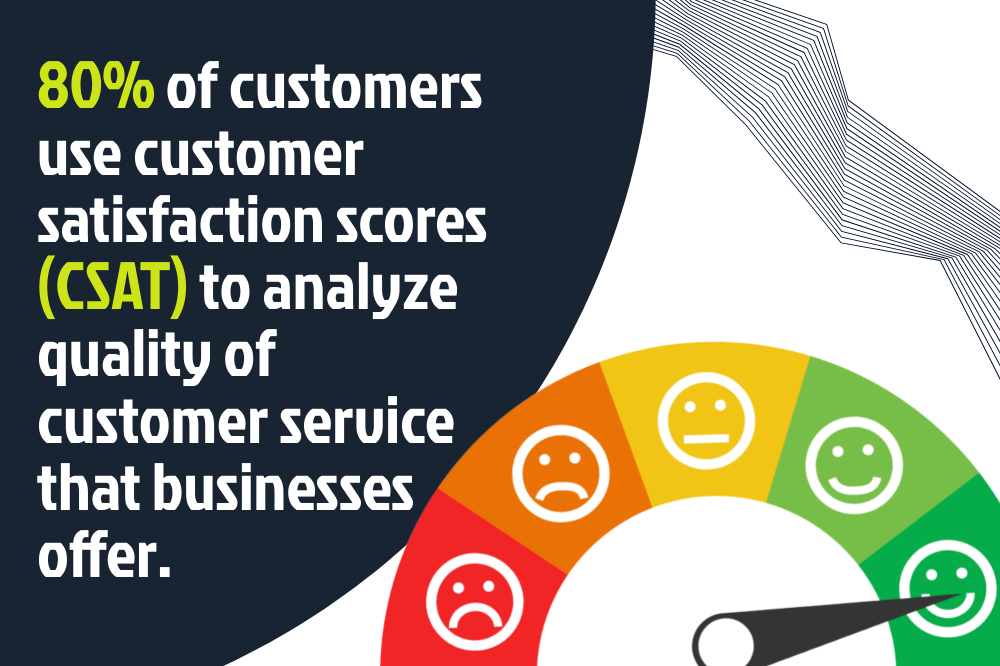
80% of customers use CSAT scores to evaluate a company’s service quality. Customer satisfaction scores are both a measurement tool and a purchasing signal. Negative CSAT scores carry real reputational consequences across review platforms and word-of-mouth channels.
86% of consumers are willing to pay more for a better customer experience, according to PwC’s Consumer Intelligence Series: Future of Customer Experience. Price sensitivity drops when service quality is high. Competing on price alone leaves this premium on the table.
60% of customers have made a purchase decision based primarily on a company’s expected service quality, even before interacting with the product. Service reputation functions as a pre-sale conversion driver, not just a retention mechanism.
9 out of 10 customers say they spend more money with brands that deliver top-quality service experiences. Revenue lift from service quality shows up in both transaction frequency and average order value.
For a fuller breakdown of the business case for customer service, including how these ROI figures map to operational decisions, see that dedicated guide.
Bad Customer Service Statistics
The cost of poor service is no longer theoretical. Multiple large-scale studies now put specific dollar figures and behavioral data behind what companies lose when service falls short.
Poor customer experience costs businesses $3.7 trillion annually worldwide, a 19% year-over-year increase. Qualtrics XM Institute reached this figure through a study of 28,400 consumers across 26 countries (Q3 2023), making it the most comprehensive cost-of-poor-service study available. 51% of those consumers said they reduce or stop spending entirely after a negative experience.
59% of US consumers will walk away from a brand they love after several bad experiences. What’s more direct: 17% leave after just one bad experience, according to PwC. One poor interaction is enough to lose nearly 1 in 5 customers permanently.
78% of customers have canceled a purchase because of a bad service experience. Cart abandonment is studied extensively in e-commerce, but service failure drives abandonment just as reliably as price friction or shipping costs. Constant support before, during, and after the purchase is what prevents this.

56% of consumers rarely complain directly about a negative experience; they simply switch to a competitor, according to Zendesk CX Trends 2026. Silent churn is the most expensive kind because companies never get feedback about why customers left. They just see the revenue disappear.
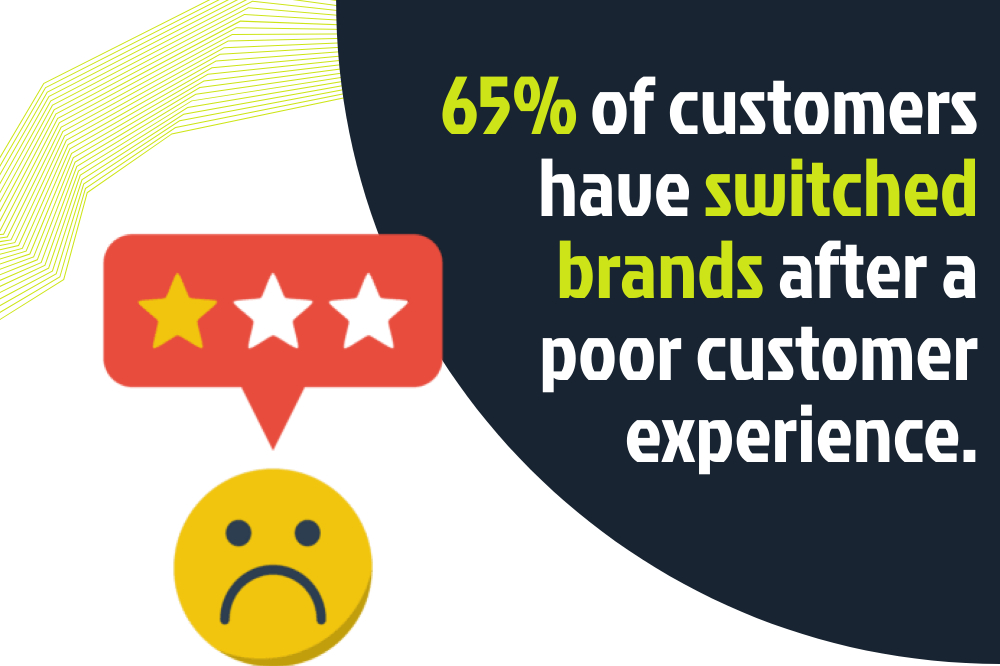
65% of customers have switched brands after a poor customer experience. That number climbs among younger demographics. Brand loyalty has a short half-life when service quality drops, and switching costs in most industries are low enough that even loyal customers can leave without friction.
73% of social media users will switch to a competitor if a brand fails to respond on social channels, per a Sprout Social Q3 2025 Pulse Survey of 336 customer care professionals. Social media response failure is now a direct competitive risk, not just a PR consideration.
72% of customers say being transferred between multiple agents for a single issue is an example of bad customer service. Customers expect their problem to be owned by whoever picks up. Every handoff increases friction and reduces the likelihood of a positive resolution rating.
Understanding practical steps to improve customer service starts with recognizing which of these failure modes affects your operation most directly.
AI Customer Service Statistics
AI in customer service is moving fast. The data from 2025 and 2026 shows a split picture: executives are pushing hard on AI adoption, the technology is delivering measurable efficiency gains in specific use cases, and customers are expressing real skepticism about AI-only service interactions.

91% of customer service leaders are under executive pressure to implement AI in 2026, not just for efficiency, but to improve CSAT scores, according to Gartner (February 2026). The pressure comes from the top, but implementation decisions rest with the CS function.
Gartner predicts agentic AI will autonomously resolve 80% of common customer service issues by 2029, with a 30% reduction in operational costs. The March 2025 Gartner prediction covers tier-0 and tier-1 interactions: FAQs, status checks, routing, and simple transactional requests.
Only 20% of customer service leaders have actually reduced agent staffing due to AI. A Gartner survey of 321 CS leaders (October 2025) found that 50% of organizations expecting significant workforce reductions will abandon those plans. The labor replacement narrative is ahead of the operational reality.
3 out of 4 customers expect AI to deliver the same level of service as human agents. The expectation is there. The execution, in most operations, is not yet meeting it.
Nearly 1 in 5 consumers who used AI for customer support saw no benefit at all, a failure rate roughly 4 times higher than other AI use cases, per the Qualtrics 2026 Consumer Experience Trends Report. Customer-facing AI has the highest visibility of any AI deployment, which makes its failure rate disproportionately costly to brand perception.
92% of customer service leaders say AI has improved response times, and AI currently resolves between 21% and 40% of service requests, according to HubSpot’s State of Customer Service 2024. Response speed is where AI earns its ROI most clearly.
Generative AI can reduce human-serviced contacts by up to 50% in banking, telecom, and utilities. One 5,000-agent operation studied by McKinsey saw 14% higher issue resolution per hour and 9% shorter average handle time, per McKinsey’s “From Promising to Productive” (August 2024). These gains are real. They are concentrated in specific, well-scoped use cases.

75% of customer support teams say AI is changing traditional customer service metrics, as teams recalibrate CSAT, customer effort scores, and resolution time benchmarks to account for AI-assisted interactions.
The Human-AI Balance Point: Across 15+ years of BPO operations, the pattern we see is consistent. AI handles tier-0 and tier-1 well (FAQs, status checks, routing). Humans handle tier-2 and above (complex issues, emotional situations, escalations). The data points the same way: 1 in 5 consumers see zero benefit from AI-only service (Qualtrics 2026) and only 20% of CS leaders have reduced headcount because of AI (Gartner). Augmentation, not replacement, is winning in 2026.
Customer Service Channel Preference Statistics
Channel preference varies by issue type, demographic, and urgency. The data below shows that no single channel dominates across all use cases. The companies winning on CX in 2026 offer the right channel for the right interaction, not one channel for everything.
Phone Support
Phone remains the second most preferred support channel at 32%, according to HubSpot’s State of Customer Service Report 2024. Phone support handles the interactions that other channels can’t: complex billing disputes, emotionally charged complaints, multi-step troubleshooting. You can see the broader picture in our call center performance statistics post.
67% of customers drop calls out of frustration when they can’t reach a representative. Long queues and transfer loops are the most common triggers. Call abandonment isn’t a customer patience problem; it’s a staffing and routing problem. Outsourced phone support with dedicated coverage is one reliable solution.
Live Chat
41% of consumers prefer live chat as their top customer service channel, making it the most preferred of all channels per HubSpot (2024). Live chat lets customers multitask, get faster responses than email, and avoid hold queues. See our post with detailed live chat data for channel-specific performance benchmarks.

48% of customers prefer companies that offer proactive customer service through live chat, meaning the chat initiates before the customer has to ask. Proactive chat reduces friction at decision points and pre-empts complaints that would otherwise become support tickets.
Email accounts for 23% of channel preference (HubSpot, 2024). It remains the dominant channel for complex, document-heavy, or formal service requests. Response time expectations for email are lengthening as customers shift urgent issues to chat and phone, but email still handles a significant share of support volume. For a comparison of messaging channel performance, see our SMS vs email performance data.
Social Media
Social media response expectations are measured in hours, not days. Sprout Social’s Q3 2025 Pulse Survey (N=336 customer care professionals) found most consumers now expect a same-day reply on public social channels, and the response window is much shorter than on email or ticketed channels. Combined with the 73% switch-to-competitor statistic above, slow social response is now a direct revenue risk.
31% of US consumers say that unresponsive customer service negatively impacts their impression of a brand. For public-facing social media, that impression is formed in front of every follower watching the interaction. The reputational cost is disproportionate to the service failure itself. Learn more about using social media as a support channel effectively.
Self-Service
61% of customers prefer self-service for simple issues, according to Salesforce State of Service 7th Ed. (2025). Knowledge bases, FAQ pages, and chatbots have absorbed significant tier-0 volume. The companies that build strong self-service infrastructure reduce inbound contact volume while improving resolution speed for the issues that remain.
57% of service professionals believe automated voice assistants will become the top preferred communication channel in the near term. The channel mix is still shifting, and the teams that adapt their staffing models to cover all high-preference channels will hold the advantage.
Customer Service Outsourcing Statistics
The outsourced customer service market is expanding alongside technology investment in CX, not being displaced by it. These figures show where investment is flowing, why executives continue to choose outsourcing partners, and what the Philippines specifically contributes to the global picture.

The global outsourced customer care services market was valued at $77.12 billion in 2024 and is projected to reach $113.18 billion by 2030 at a 6.6% CAGR, per Grand View Research. A separate projection from IMARC Group estimates the market could reach $147.86 billion by 2033 at 7.10% CAGR. Both projections point to sustained acceleration, not a post-pandemic correction.
The broader CX BPO market sits at $102.03 billion in 2024 and is projected to reach $296.29 billion by 2033 at 12.8% CAGR (Grand View Research). Front-office work (customer service, sales, support) is now one of the largest outsourcing categories by spend, running parallel to the traditional back-office BPO market rather than replacing it.
80% of executives plan to maintain or increase their third-party outsourcing investment, according to the Deloitte Global Outsourcing Survey 2024, which surveyed 500+ executives. Outsourcing is not being pulled back by AI investment; it’s expanding alongside it. See the full outsourcing market data for broader context on global outsourcing trends.
The Philippines is widely recognized as the world’s leading destination for outsourced customer experience work, holding a double-digit share of the global contact center market. That position is built on English language proficiency, service-oriented culture, and competitive labor economics, reinforced by the scale of national IT-BPM infrastructure tracked by IBPAP below.
The Philippine IT-BPM sector generated $40 billion in export revenues in 2025, employing 1.9 million workers. IBPAP projects the sector will reach $59 billion in revenue and 2.5 million employees by 2028, outpacing global BPO growth rates. For companies evaluating the Philippines as a service delivery location, these figures reflect a mature, expanding industry, not an emerging one.
The global CX management market stands at $15.55 billion in 2025 and is projected to reach $47.72 billion by 2033 at 15.2% CAGR, per Grand View Research. Technology investment in CX infrastructure is running parallel to the outsourcing market growth, not replacing it.
Digital Minds BPO, a business process outsourcing company based in Naga City, Philippines with 15+ years of operations and a 94% client retention rate, provides customer service outsourcing to mid-market companies in the US, UK, Australia, and New Zealand. For more on what to look for when choosing a partner, read our breakdown of the tradeoffs of outsourcing customer service. To review service options, visit our customer service outsourcing services page.
Methodology and Sources
The statistics in this post were selected based on source credibility, sample size, recency (2023-2026), and relevance to operational decisions. We prioritized primary research over secondary aggregations. Where multiple sources reported on the same finding, we cited the most authoritative primary source. Older statistics (pre-2022) were retained only where the finding is foundational (the Bain/HBR retention-to-profitability research, for example) and remains widely cited in current literature. Sources used in this post include:
- Zendesk CX Trends 2026 (via PRNewswire): global CX trends, AI expectations, channel behavior
- Gartner: AI adoption pressure (Feb 2026), agentic AI predictions (March 2025), headcount reduction survey (Oct 2025, N=321)
- Qualtrics XM Institute: $3.7T cost-of-poor-service study (Q3 2023, N=28,400, 26 countries); 2026 Consumer Experience Trends Report
- Salesforce: State of the AI Connected Customer 7th Ed. (2024); State of Service 7th Ed. (2025)
- Grand View Research: CX management market, outsourced customer care market, CX BPO market sizing
- PwC: Consumer Intelligence Series: Future of Customer Experience
- HubSpot: State of Customer Service Report 2024 (N=1,400 service leaders)
- McKinsey: “From Promising to Productive: Real Results from Gen AI in Services” (August 2024)
- Sprout Social: Q3 2025 Pulse Survey (N=336 customer care professionals)
- Deloitte: Global Outsourcing Survey 2024 (N=500+ executives)
- Harvard Business Review / Bain and Company: Reichheld retention-to-profitability research
- IBPAP via Philippine Daily Inquirer: Philippine IT-BPM sector 2025 data
What Customer Service Statistics Mean for Your Operation
The data in this post points in one consistent direction: customers have raised the bar on what they expect, the cost of failing to meet that bar keeps climbing, and the companies investing in service quality are seeing it pay off in retention and revenue. That is the same pattern the data has shown for years, but the 2026 numbers are sharper and the stakes are higher.
The AI picture is more complicated. Pressure to implement is real. So are efficiency gains in specific use cases. But 1 in 5 customers see zero benefit from AI-only support, and only 20% of CS leaders have actually reduced staffing. The organizations winning in 2026 are augmenting human agents with AI tools, not replacing agent capacity with automation. The data supports that approach.
If you’re building a service model that covers the channels your customers prefer, with the staffing levels needed to meet response time expectations, and at a cost structure your business can sustain, outsourcing to a dedicated team is worth a serious look. Digital Minds BPO has built customer service teams for mid-market companies in the US, UK, Australia, and New Zealand for over 15 years, with a 94% client retention rate and an average partnership of 4.7 years. The proof is in the numbers.
Frequently Asked Questions About Customer Service Statistics
What percentage of customers leave after bad customer service?
PwC found that 17% of US consumers will leave a company after just one bad experience. After several bad experiences, 59% walk away. On top of that, Zendesk CX Trends 2026 found that 56% of dissatisfied customers don’t complain; they simply switch to a competitor without warning. Silent attrition is often larger than the visible complaint volume suggests.
How much does poor customer service cost businesses?
Qualtrics XM Institute quantified the global cost at $3.7 trillion annually (based on a Q3 2023 study of 28,400 consumers across 26 countries), a 19% year-over-year increase. The cost comes from lost spend: 51% of consumers reduce or stop spending entirely after a negative experience. For individual companies, the Bain/Harvard Business Review research shows that retaining just 5% more customers increases profits by 25-95%.
What’s the most preferred customer service channel in 2026?
Live chat leads at 41% preference, followed by phone at 32% and email at 23%, per HubSpot’s State of Customer Service 2024 (N=1,400 service leaders). Self-service is also rising: 61% of customers prefer self-service for simple issues (Salesforce, 2025). Channel preference varies by issue complexity, with phone and live chat preferred for urgent or complex problems and self-service preferred for routine ones.
How is AI changing customer service?
AI is delivering measurable gains in specific use cases. HubSpot (2024) found 92% of CS leaders say AI has improved response times, and AI currently resolves 21-40% of service requests. McKinsey’s 2024 research found GenAI can reduce human-serviced contacts by up to 50% in banking and telecom, with one large operation seeing 14% higher resolution per hour. The counterweight: nearly 1 in 5 customers using AI for support saw no benefit at all (Qualtrics 2026), and Gartner found only 20% of CS leaders have actually reduced headcount due to AI. Augmentation models outperform replacement models in the current data.
What’s the ROI of good customer service?
The Harvard Business Review and Bain research found that a 5% improvement in customer retention increases profits by 25-95%. Salesforce (2024) found 88% of customers are more likely to purchase again after a great service experience. PwC found 86% of consumers are willing to pay more for better CX. Together, these figures show that service quality affects acquisition costs, repeat revenue, average transaction value, and referral rates simultaneously.
What are the benefits of outsourcing customer service?
Outsourcing customer service to a dedicated team in the Philippines gives mid-market companies 24/7 coverage, cost-efficient talent at rates well below equivalent US or UK hiring, and access to experienced agents without the overhead of recruitment, training infrastructure, and facilities. The Deloitte Global Outsourcing Survey 2024 found 80% of executives plan to maintain or increase outsourcing investment, and the Philippine IT-BPM sector generated $40 billion in export revenues in 2025 with 1.9 million workers, per IBPAP. If social channels are a key part of your service mix, social media customer service outsourcing is also worth reviewing.

Charvel Rebagay is the CEO and Founder of Digital Minds BPO, a Philippines-based outsourcing company he established in 2010. Based in Naga City, he works directly with clients and teams daily to ensure service quality across every engagement. With over 15 years of experience building and managing dedicated teams for businesses worldwide, Charvel has helped hundreds of companies scale their operations through skilled Filipino professionals. Under his leadership, Digital Minds BPO operates 3 dedicated facilities with a 94% client retention rate, serving Fortune 500 clients including P&G and Petron.