These 46 patient no-show statistics, compiled in 2026 from sources published between 2011 and 2026, each name the publisher and the year, plus the sample wherever the source discloses one. A final section lists the widely repeated figures that could not be traced to any study.
The central finding is that the no show rate has no single national value. Epic Research’s 2024 data on more than 1.6 billion face-to-face outpatient visits puts the no-show rate at 6.2% for patients active on a portal and 7.9% for those who were not. Three single-center studies in this post report overall rates of 14.3% to 21.2%, and a 2024 systematic review by Mazaheri Habibi and colleagues found clinic rates between 12% and 42%. Each dataset measures a different setting, patient mix, and counting rule, so the figures can all be correct.
Digital Minds BPO, a business process outsourcing company in Naga City, Philippines, compiled this list from published sources and holds no proprietary no-show data. Nothing below describes the company’s own results.
How These Patient No-Show Statistics Were Sourced
Every figure comes from a named publisher, and the link sits on the first mention of that source. Where a source reports a sample size, the sample appears beside the number. The sources fall into four groups: peer-reviewed studies and reviews, practice polls from the Medical Group Management Association (MGMA), two large dataset analyses (Epic Research and MGMA’s DataDive), and one vendor survey, labeled where it appears. Each published finding counts once toward the 46: a comparison pair, or a breakdown by age, insurance, clinic, or poll answer, is one statistic, and the untraced figures in the final section are not counted.
How a no-show is counted changes the number. In the simplest count, a no-show is a scheduled patient who neither attends nor cancels ahead of time. Cancellations then form a separate outcome, and in the sources here they run larger.
MGMA’s January 2025 poll article reports a single-specialty DataDive no-show series that stays between 5% and 7% from 2019 to 2023, while MGMA’s August 2026 article, citing its 2025 DataDive, puts the 2024 appointment cancellation rate at 19.95%. In a 2022 Johns Hopkins Community Physicians analysis by Woodcock, Sen, and Weiner, cancellations reached 37.6% of self-scheduled and 27.0% of agent-scheduled appointments. A study that folds late cancellations into its no-show count will report a higher rate than one that tracks them apart.
Setting matters too. Large datasets average across many practices and specialties. A single-clinic study captures one patient mix, one scheduling process, and one period; the Veterans Affairs (VA) figures here cover fiscal years 1997 to 2008. Figures appear as published, none is adjusted to a common definition, and where a source contradicts itself, both numbers are shown.
Digital Minds BPO staffs front-office teams for healthcare practices through its healthcare BPO services, so it has a commercial interest in the reminder and rescheduling evidence below.
Key Patient No-Show Statistics for 2026
- Epic Research’s 2024 data: patients active on a portal missed 6.2% of visits, against 7.9% for patients who were not.
- MGMA’s DataDive single-specialty aggregate no-show rate: 7% in 2019, 5.55% in 2020, 5% in 2021 and 2022, and 6.81% in 2023.
- A 2011 review by Hasvold and Wootton of 29 studies found a median baseline non-attendance of 23%; a VA Houston study by Kheirkhah and colleagues averaged 18.8% across 10 clinics over fiscal years 1997 to 2008.
- In the MGMA poll of August 11, 2026, 32% of practices reported higher no-show rates year to date than in 2025, 58% about the same, and 10% lower.
- The Cochrane review of 2013 found text reminders raised attendance over no reminder (risk ratio 1.14) and performed about the same as phone calls (risk ratio 0.99).
- Hasvold and Wootton: automated reminders cut non-attendance by 29% of baseline, manual phone calls by 39%.
- $196 per no-show in 2008 dollars at one VA medical center; MGMA’s 2025 DataDive found only 27.40% of visits canceled in 2024 were rescheduled within 30 days.
- The “$150 billion a year” figure traces to a 2017 commentary that names no study.
Average No-Show Rate: Why Published Figures Range From 5% to More Than 40%
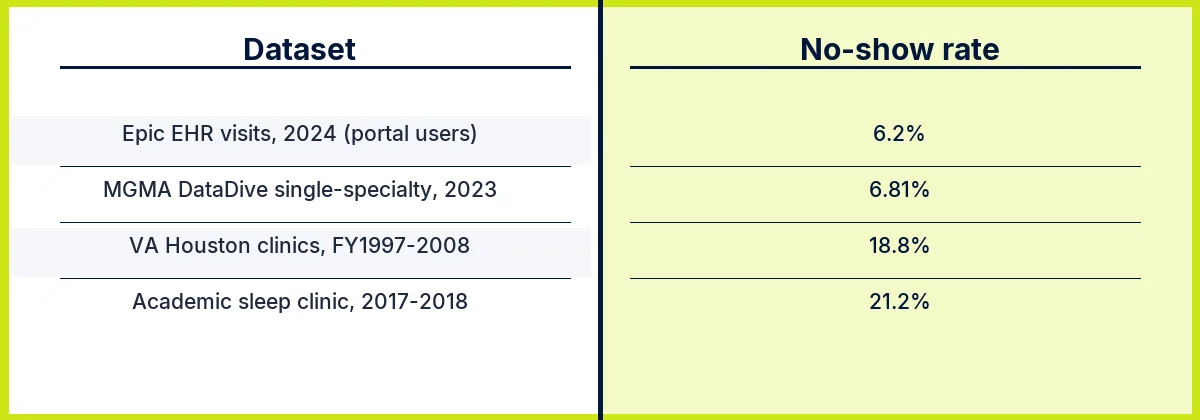
The published average no show rate runs from about 5% to more than 30%, and each figure is defensible for what it measures. The table sets the five main reference points side by side.
| Source, year | No-show rate | What it covers |
|---|---|---|
| Epic Research, 2024 data | 6.2% (portal-active) and 7.9% (not) | More than 1.6 billion face-to-face outpatient visits |
| MGMA DataDive, 2019 to 2023 | 7% (2019), 5.55% (2020), 5% (2021 and 2022), 6.81% (2023) | Single-specialty aggregate, reported in MGMA’s January 2025 poll article |
| Hasvold and Wootton, 2011 | 23% median baseline | 29 reminder studies; the non-attendance rate without reminders |
| Kheirkhah et al., 2016 | 18.8% mean (SD 2.4%) | 10 clinics at one VA medical center, fiscal years 1997 to 2008 |
| Mazaheri Habibi et al., 2024 | 12% to 42%, with rates that can reach around 50% | 16 studies from 23,403 records, search to July 2023 |
Figures are as published. The sources use different denominators and settings and are not adjusted to a common definition.
No federal no-show series appears in any source cited here. The national picture comes from two private datasets, each limited to the practices that contribute to it, and both sit at roughly 5% to 8%. Neither covers every US practice, so neither works as a national benchmark.
The gap to the clinic studies has three visible variables: definition, setting, and era. The VA data ends in fiscal year 2008, and Hasvold and Wootton’s studies were published by 2011. Both sit well above the 2024 datasets, though the sources do not separate the effect of era from definition and setting. A practice benchmarking itself should choose the reference that matches its own specialty, scheduling process, and counting rules.
No-Show Rates by Setting and Specialty
None of the sources in this post gives a single primary care benchmark, so the “average no show rate for primary care” cannot be read from one figure. The closest large reading comes from Woodcock, Sen, and Weiner: 4.6% of agent-scheduled appointments at Johns Hopkins Community Physicians, a predominantly primary care group with more than 30 sites. MGMA’s DataDive series is a single-specialty aggregate that is not broken out by primary care in the published figures.
| Setting | No-show rate | Sample, source |
|---|---|---|
| Primary care group (Johns Hopkins Community Physicians) | 4.6% of agent-scheduled appointments | 1,995,909 appointments across 30+ sites; Woodcock, Sen, and Weiner, JAMIA 2022 |
| Sleep clinic (SLUCare) | 21.2% | 2,532 visits, July 2017 to April 2018; Cheung et al., Journal of Clinical Sleep Medicine 2020 |
| Pediatric dental clinic (University at Buffalo) | 14.3% | 7,379 visits, 825 patients, 2018 to 2023; International Journal of Dentistry 2025 |
| VA gastroenterology clinic | 25.7% | VA Houston, fiscal years 1997 to 2008; Kheirkhah et al., 2016 |
| VA audiology clinic | 12.6% | VA Houston, fiscal years 1997 to 2008; Kheirkhah et al., 2016 |

Figures are as published. Most appointments in the primary care group were agent-scheduled (1,839,824 of 1,995,909).
Inside a single institution, the spread is wide. The VA gastroenterology rate is about twice the audiology rate, from the same medical center and the same years. The Buffalo dental data splits by age: 6.8% for ages 0 to 7, 8.4% for ages 8 to 11, 24% for ages 12 to 17, and 19% for ages 18 and older.
In these sources, age and patient status move the rate within a single clinic, so a specialty label alone says little about what rate to expect.
Are No-Shows Rising? MGMA Practice Poll Results
MGMA polls ask practices which direction their no-show rate moved, so they report a direction of change and give no rate. The answers across four polls are mixed, with a rise in the share reporting higher rates between 2025 and 2026.
| Poll | Worse or higher | About the same | Better or lower |
|---|---|---|---|
| August 2024 poll, as cited in MGMA’s January 2025 article (sample not stated there) | 37% | 50% | 18% |
| January 7, 2025 poll, 2024 versus 2023 (622 responses) | 20% worse | 58% consistent | 22% improved |
| August 12, 2025 poll (265 responses) | 27% increased | 60% | 13% decreased |
| August 11, 2026 poll, year to date versus 2025 (190 applicable responses) | 32% higher | 58% | 10% lower |
Figures are as published. The August 2024 shares, as cited by MGMA, add to 105%.
The share reporting higher no-shows rose 5 points between the August 2025 and August 2026 polls, from 27% to 32%. Most practices still reported no change, and a poll of direction cannot say whether the underlying rate moved by one point or ten.
The January 2025 poll also asked about fees: 42% of practices use a no-show fee and 58% do not. Among fee practices, 25% reported improvement, against 16% of practices without one. That is an association between two survey answers, not a controlled test, and MGMA presents its $25 to $50 fee range for primary care as advice.
MGMA’s December 2025 poll, reported in its August 2026 article, asked practices for their top access priority: 27% chose no-shows, 24% online scheduling, 22% phone access, and 21% wait times. Phone access, a front-desk function, sat within five points of no-shows.
Lead Time and Patient Factors
Lead time, patient status, insurance, and age each move the rate in the studies below. The lead-time figures come from a single urban residency clinic, so they show a pattern that may not hold elsewhere.
| Factor | No-show rates | Source and sample |
|---|---|---|
| Lead time | 8% at 0 to 3 days, 16% at 4 to 6 days, 22% at 28 to 30 days | DuMontier et al., Family Medicine 2013, one urban residency clinic, cited in the Mazaheri Habibi review |
| Patient status | 30.5% new patients, 18.3% established patients | Cheung et al., 2,532 sleep clinic visits |
| Insurance | 24.6% no insurance, 22.6% public, 15.9% private | Cheung et al.; the Results text gives private as 15.8% |
| Age, sleep clinic | 14.0% age 65 and older, 21.5% ages 17 to 40, 23.5% ages 41 to 64 | Cheung et al. |
| Age, portal-active versus not | Ages 18 to 34: 9.3% versus 10.9%. Ages 35 to 49: 7.8% versus 9.9%. Ages 50 to 64: 6.2% versus 8.7% | Epic Research, 2024 data |
Figures are as published. Each row comes from a different setting and cannot be added to the others.
Two patterns stand out. Longer lead times go with higher rates in the residency clinic, and in Epic’s data the rate falls with each older age band, whether or not the patient used a portal. The sleep clinic also has its lowest rate at age 65 and older, but its highest is in the 41 to 64 band.
Reasons patients give are a separate question. MGMA’s August 2026 article reports a Tebra 2026 survey of 473 providers and 3,196 patients; Tebra is a software vendor, so this is vendor research reported by MGMA. Among providers, 81% cite forgetting. Patients cite work (31%), weather (30%), and emergencies (27%), and 69% say they want to reschedule online.
Appointment Reminder Statistics: What the Trials Show
Reminders help, and the effect is modest. The Cochrane review, Hasvold and Wootton’s review, and a 2026 meta-analysis agree on direction and leave the channel question open.
| Source, year | Design | Finding |
|---|---|---|
| Cochrane, Gurol-Urganci et al., 2013 | 8 randomized trials, 6,615 participants, searched to August 2012; low to moderate quality overall | Text versus no reminder: risk ratio 1.14 (95% CI 1.03 to 1.26; 7 studies, 5,841 participants). Text versus phone call: 0.99 (0.95 to 1.02; 3 studies, 2,509 participants). Attendance: 67.8% with no reminder, 78.6% with text, 80.3% with a call. Text cost per attendance was 55% and 65% lower than calls in two studies. |
| Hasvold and Wootton, 2011 | 29 studies (33 estimates), 9 of them randomized trials | Relative reduction in non-attendance, as a share of baseline: 34% weighted mean; 29% for automated reminders and 39% for manual phone calls. No difference between a reminder sent the day before and one sent a week before. About €0.41 per reminder. |
| Al-Turbag, Mooney, and Corry, 2026 | 10 pooled studies, 8,236 participants | All reminders: risk ratio 1.11 (1.05 to 1.19; I-squared 83%). Telephone: 1.11 (1.04 to 1.19; 5 studies, 3,369 participants). SMS: 1.14 (0.99 to 1.31; 4 studies, 4,636 participants; P=0.07, not significant). |
| Kheirkhah et al., 2016 | VA Houston, fiscal years 1997 to 2008 | Reminder letters: no change in the no-show rate (p=0.70). A centralized phone system: 16.3% to 15.2% in the body text; the abstract gives 15.8%. |

Figures are as published. Risk ratios are for attendance; above 1 favors the first option named (a reminder over none, or text over a call). Hasvold and Wootton state the cost both per reminder and per patient; it is shown per reminder here.
The channel question has a caveat built in. Al-Turbag and colleagues found a significant effect for telephone reminders and a non-significant one for SMS, but the review “did not directly compare SMS and telephone reminders.” The two estimates cannot rank the channels, and the SMS point estimate is the larger of the two.
The clearest channel results come from two reviews. In Cochrane, text performed about the same as phone calls on attendance and cost less per attendance in two studies. In Hasvold and Wootton, manual calls produced a larger relative reduction than automated reminders, and timing made no difference between the day before and a week before.
Reminders support a front-desk team. Someone still handles the patients who do not reply, the reschedules, and the incoming calls, which is the work behind healthcare call center outsourcing. Practices handing that work to an outside team should first check the HIPAA requirements for call centers.
Patient Portal, Self-Scheduling, and Telehealth Statistics
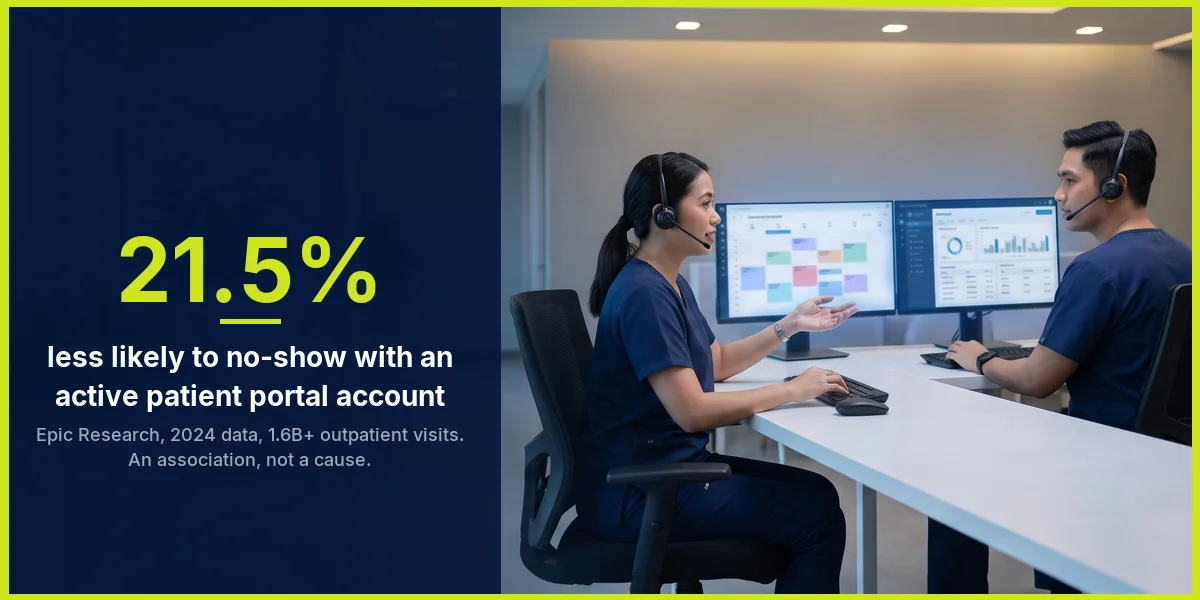
Epic Research found portal-active patients 21.5% less likely to no-show, or 6.2% against 7.9%. The analysis estimated roughly 1,700 fewer no-shows per 100,000 visits, and more than 21 million fewer across 1.26 billion visits. A sensitivity analysis covering demographics, lead time, prior no-shows, insurance, and other factors “showed similar patterns.” The result is an association, and portal users may differ from non-users in ways the analysis cannot rule out.
Woodcock, Sen, and Weiner compared self-scheduled and agent-scheduled visits across 1,995,909 appointments. Self-scheduled visits had a 2.7% no-show rate (4,247 of 156,085) and agent-scheduled visits 4.6% (85,531 of 1,839,824). The authors call it an exploratory case study, the self-schedulers were younger and more often commercially insured, and no adjustment is described. The figures do not show that self-scheduling causes fewer no-shows.
On telehealth, Greenup and Best’s 2025 meta-analysis pooled 45 retrospective cohort studies published from January 2020 to June 2023. Telehealth visits had lower odds of a no-show than in-person visits (log odds ratio -0.49, 95% CI -0.66 to -0.32, an odds ratio of 0.61). Heterogeneity (I-squared) was 99.89%, which the authors flag as the main limitation; the pooled number summarizes very different settings.
The Cost of a Patient No-Show
The most specific traced cost is $196 per no-show in 2008 dollars, from Kheirkhah and colleagues at the Michael E. DeBakey VA in Houston. It was built from the average cost per encounter, used as a stand-in for the marginal cost of one missed visit. That makes it a VA accounting figure for one medical center and one year; a private practice should not apply it to its own schedule.
MGMA’s 2025 DataDive offers a related measure: 19.95% of appointments were canceled in 2024, and only 27.40% of those canceled visits were rescheduled within 30 days. MGMA also says not to treat 19.95% as a universal target. The rescheduling figure is the one that points to front-desk work, since each rebooking starts with a call or a message that someone has to follow up.
The billing side of an empty slot is a separate staffing question; Digital Minds BPO’s guide to medical billing outsourcing covers how practices staff that work.
Patient No-Show Figures We Could Not Trace to a Study
Three families of figures circulate widely, and none could be traced to a study. Repetition across many pages adds reach to a number, not evidence, so each is listed here with the earliest source found, where one exists.
| Figure as repeated | Earliest source found | What the source provides |
|---|---|---|
| “$150 billion a year” in missed appointments | Healthcare Innovation commentary, April 26, 2017, by the CMO of a scheduling software vendor | The figure, with no study named and no arithmetic shown |
| “$200” per unused appointment slot | Same 2017 commentary | The figure, with no study named |
| No-show rates “as high as 30% nationwide” | Same 2017 commentary | The claim, with no study named; the national datasets above sit at roughly 5% to 8% |
| A specialty table: Sleep 39%, Pediatrics 30%, Dermatology 30%, and similar rows | No primary study found | The sourced sleep clinic rate in this post is 21.2% (Cheung et al.), and the sourced pediatric dental rate is 14.3% |
| Reminders cut no-shows by 50%, 70%, or 75% | No trial found | Hasvold and Wootton’s weighted mean relative reduction across 29 studies is 34% of baseline non-attendance, and the largest, for manual phone calls, is 39% |
The pages that repeat these figures are not named. Only the earliest source found is cited.
The 2017 commentary is the earliest source found for the first three figures, and it gives them with no study and no arithmetic. The cost section above shows what a traced cost looks like by contrast: a named medical center, a stated year, and a stated method with its weakness disclosed.
Conclusion
The reminder, portal, and scheduling tools in this post still depend on people at the front desk: someone makes the call, takes the reply, and rebooks the slot. Digital Minds BPO staffs office-based front-desk teams in Naga City for healthcare practices, covering patient calls, reminders, and rescheduling through its virtual medical receptionist service and its medical appointment scheduling services. If your practice is weighing how to staff that work, the conversation starts there.
FAQ: Patient No-Show Statistics
What is a good no-show rate for a medical practice?
None of the sources in this post sets a national benchmark for a good rate. MGMA’s DataDive single-specialty aggregate sat between 5% and 7% from 2019 to 2023, and Epic Research’s 2024 data shows 6.2% for portal-active patients and 7.9% for others, so a rate in that band matches the large datasets. Three single-center studies in this post report 14.3% to 21.2%, and a practice’s specialty, patient mix, and treatment of cancellations decide which comparison fits.
What is the average no-show rate for primary care?
None of the sources in this post gives a single primary care average. The closest large reading is 4.6% of agent-scheduled appointments at Johns Hopkins Community Physicians, a predominantly primary care group with more than 30 sites (Woodcock, Sen, and Weiner, 2022). MGMA’s DataDive no-show series is a single-specialty aggregate that is not broken out by primary care.
How much does a patient no-show cost?
The most specific traced figure is $196 per no-show in 2008 dollars at one VA medical center (Kheirkhah et al., 2016), calculated from average cost per encounter. The widely repeated “$150 billion a year” traces to a 2017 commentary that names no study.
Are phone call reminders better than text reminders?
In these reviews, calls performed at least as well as texts, and texts cost less. Cochrane found attendance of 78.6% with text and 80.3% with a call (risk ratio 0.99 for text versus call), with text cost per attendance 55% and 65% lower in two studies. Hasvold and Wootton found manual calls cut non-attendance by 39% of baseline, against 29% for automated reminders. Al-Turbag and colleagues found a significant effect for phone and a non-significant one for SMS, but did not compare the two directly.
How to reduce patient no shows: what does the evidence support?
Reminders have the strongest trial support, at a modest size: a risk ratio of 1.14 for text versus no reminder in Cochrane, and a 34% weighted mean relative reduction in non-attendance in Hasvold and Wootton. In Mazaheri Habibi and colleagues’ 2024 review, 10 of 16 studies found a significant decrease with open access scheduling. Fee practices reported improvement more often (25% against 16%), and telehealth carried lower odds of a no-show (odds ratio 0.61). Both are associations, one from a practice poll and one from a pooled analysis with very high heterogeneity, so they suggest a direction without showing cause.

Sofia Reyes is a Content Writer and SEO Specialist at Digital Minds BPO, where she focuses on outsourcing-industry research and educational content for business decision-makers. Based in the Philippines, she has 7 years of experience writing B2B content across SEO, content strategy, and Generative Engine Optimization (GEO). Sofia partners with Digital Minds BPO’s operations and account management teams to translate 15+ years of frontline BPO experience into clear, sourced guides on call center, customer service, and back-office outsourcing. Her work supports prospects evaluating outsourcing decisions across the company’s three dedicated facilities, where the team delivers a 94% client retention rate for clients ranging from Fortune 500 enterprises to growth-stage businesses.