These 59 medical billing industry statistics for 2026 name the publisher of each figure and, wherever the publisher states them, its data year and base. They cover claim denial rates, denial reasons, appeals, rework cost, administrative cost, days in accounts receivable (AR), the billing and coding workforce, and patient debt. A final section lists widely repeated figures that are stale or have no traceable source.
The central finding is that published headline denial rates run from 7% to 20% because each source counts something different. KFF’s analysis of 2024 CMS claims data found 20% of all claims denied on HealthCare.gov plans, while MGMA reports first-submission denials of 8% and Kodiak Solutions reports an initial denial rate of 11.81% on its own platform. One counts claims ultimately denied across 157 insurers, one counts first submissions, and one counts claims that pass through a single vendor’s platform.
Digital Minds BPO, a business process outsourcing company based in Naga City, Philippines, compiled this list from published sources. The company holds no proprietary denial, appeal, or collections data, and nothing below describes its own results.
How These Medical Billing Statistics Were Sourced
A claim denial is a payer’s decision, after processing a claim, not to pay it. A claim rejection is different: the payer or a clearinghouse returns the claim before processing because of a data or format error, so it is not a denial. A prior authorization denial is a third thing, a payer declining approval before care is delivered, and those figures sit in the prior authorization statistics post. Every denial figure below is a claim denial figure unless the sentence says otherwise.
The denial sources fall into three kinds. Claim-level data comes from KFF, which analyzes CMS files; its 2023 plan-year analysis covered 471 million claims from 175 insurers, and its 2024 analysis covered 157 insurers. Platform data comes from Kodiak, whose release gives no claim count or denial definition. Survey data comes from Premier’s survey of 280 hospitals in 23 states, Experian Health’s 2026 State of Claims findings (n=204), and its 2025 State of Claims survey (n=250). It also draws on an MGMA Stat poll of July 2026 and MGMA DataDive benchmarks, whose base MGMA’s public pages do not state.
Experian Health, Kodiak Solutions, and Premier are commercial publishers. Their figures describe only their own respondents or platform users, and this post labels each by publisher and base. Experian’s full reports sit behind a form, so only its public blog post and press release are cited.
A statistic here is one measure from one publisher. An earlier year, or a split shown beside it, counts with it. Figures that appear only in the audit section are not among the 59. The link sits on the first mention of each source, and later mentions are text only. Digital Minds BPO offers healthcare BPO services and so has a commercial interest in the staffing work described near the end.
Key Medical Billing Industry Statistics for 2026
- KFF, 2024 plan year: 19% of in-network claims, 37% of out-of-network claims, and 20% of all claims on HealthCare.gov plans were denied.
- Denial rates by source: 7% to 8% (MGMA, first submission), 11.81% (Kodiak, initial denials), nearly 15% (Premier, hospital survey), and 20% (KFF, all HealthCare.gov claims).
- Experian, 2026: 40% of survey respondents report denial rates of 10% or higher. That is a share of respondents, not a claim denial rate.
- KFF, 2024: the largest category of reported in-network denial reasons is “other” at 36%, followed by administrative reasons at 25%, excluded services at 13%, and medical necessity at 5%.
- KFF, 2024: at least 262,982 denials were appealed, under 1% of denials.
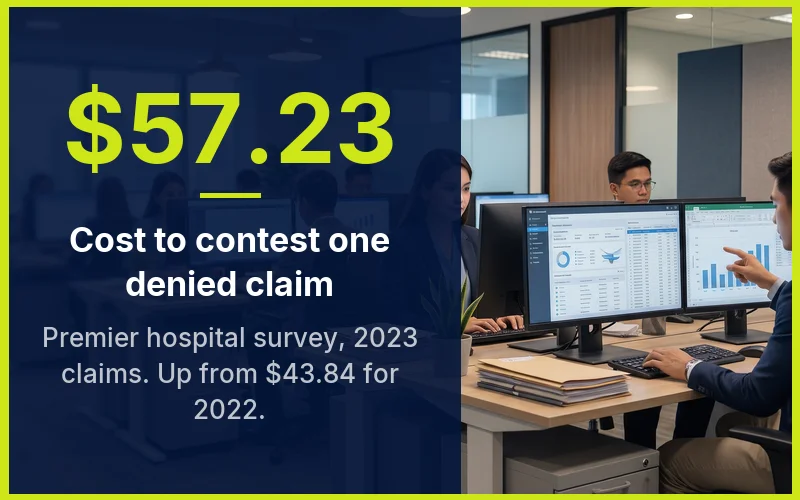
- Premier, 2023 claims: contesting a denied claim cost hospitals $57.23, up from $43.84 for 2022 claims.
- Premier: about 70% of denials at the hospitals surveyed were overturned.
- MGMA Stat, July 2026 (203 responses): 43% report days in AR holding steady, 32% higher, and 22% lower.
Claim Denial Rate Statistics
KFF supplies the only claim-level denial counts in this post, and they cover ACA Marketplace plans on HealthCare.gov. For the 2024 plan year, KFF found 19% of in-network claims denied (about 85 million of 451 million), 37% of out-of-network claims, and 20% of all claims (about 496 million). The 2023 edition sits beside it in the table below.
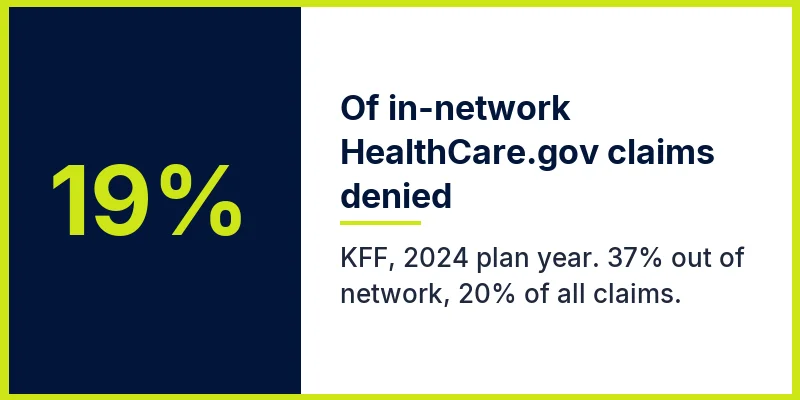
Insurers differ more than years do. KFF’s 2024 insurer-level denial rates ran from 3% to 36%, and state averages ran from 7% in South Dakota to 27% in Hawaii. In 2023 the insurer range was 1% to 54%.
| Measure | KFF 2023 plan year | KFF 2024 plan year |
|---|---|---|
| Claims analyzed | 471 million | About 496 million (all claims) |
| Insurers | 175 | 157 |
| In-network claims denied | 20% | 19% (about 85 million of 451 million) |
| Out-of-network claims denied | 36% | 37% |
| All claims denied | 20% | 20% |
| Range across insurers | 1% to 54% | 3% to 36% |
Source: KFF analyses of CMS files for HealthCare.gov plans. The 2024 analysis was published March 24, 2026. The 2023 analysis was published January 27, 2025, and updated March 24, 2026, for corrected CMS data.
Other publishers measure other populations. Premier’s hospital survey describes denial rates as consistent at nearly 15% across claims from 2023, and as high as 49% in certain instances. MGMA’s DataDive puts first-submission denials at 8% (single-specialty aggregate, 2023 data set), and at 7% to 8% over four years. Kodiak’s 2024 initial denial rate of 11.81% came with a reported 2.4% rise, which is a relative rise, not 2.4 percentage points. The release says “of claims” and does not define the denominator.
Two surveys count people, not claims. Experian found 40% of respondents reporting denial rates of 10% or higher in 2026, against 41% in 2025. A March 2024 MGMA Stat poll of 235 respondents found 60% of leaders reporting higher denials and 11% reporting lower.
Why Published Denial Rates Run From 7% to 20%
These rates do not all measure the same thing. A denial rate depends on three choices: what is counted (claims or respondents), which claims sit in the base, and when the count is taken. The five publishers below do not make the same choices, and Kodiak and MGMA do not define the base on their public pages.
| Source | What it counts | Base | Rate |
|---|---|---|---|
| KFF, 2024 plan year | Claims ultimately denied; claims denied, resubmitted, and then paid are left out | CMS files, HealthCare.gov plans, 157 insurers | 19% in-network; 20% all claims |
| Premier, claims from 2023 | Denial rate reported in its hospital survey | 280 hospitals in 23 states | Nearly 15% |
| Kodiak, 2024 | Initial denials, “of claims” in the release | Platform data; no claim count or definition | 11.81% |
| MGMA DataDive | First-submission denials | Base not stated on the public page | 8%; 7% to 8% over four years |
| Experian, 2026 | Share of respondents reporting denial rates of 10% or higher; not a denial rate | Survey, n=204 | 40% of respondents |
Sources: KFF, Premier, Kodiak, MGMA, and Experian, as cited in the sections above. Rates are as each publisher states them.
Match the count before comparing a practice’s own rate with a benchmark. KFF’s rate is the closest thing here to a final figure, because it leaves out claims that were denied, resubmitted, and then paid. Kodiak’s and MGMA’s rates are taken at the first decision, and a share of respondents is not a rate at all. KFF covers HealthCare.gov plans only, so no source here gives a final denial rate for all payers.
Why Claims Get Denied
KFF and Experian approach the question from opposite sides. KFF reports the reasons insurers gave for in-network denials; Experian reports what survey respondents say causes their denials.
| Source and base | Reasons and shares |
|---|---|
| KFF, 2024 (in-network claims; reasons reported for about 75% of claims) | Other 36%, administrative 25%, excluded service 13%, medical necessity 5% |
| KFF, 2023 (in-network claims) | Other 34%, administrative 21%, excluded service 14%, medical necessity about 6% |
| Experian, 2026 (n=204, top-three picks) | Services not covered 53%, changing payer policies 31%, code inaccuracy 25% |
| Experian, 2025 (n=250) | Missing or inaccurate data 50% (46% in 2024), incomplete registration 32% |
| Kodiak, 2024 against 2023 (platform data) | Medical necessity denials up 5%, more-information requests up 5.4% |
Sources: KFF 2024 and 2023 analyses, Experian 2026 and 2025, and Kodiak. Experian’s 2026 shares are top-three picks, so they do not sum to 100%. Its authorization reasons are left out here and covered in the prior authorization statistics post.
“Other” is the largest category in KFF’s list in both years, at 36% in 2024 and 34% in 2023. KFF’s 2024 analysis describes it as “reason not listed” and does not say what falls inside it. KFF also notes that each reason is tallied separately and a claim can carry more than one. Administrative reasons come next, at 25% and 21%. Experian’s respondents ranked services not covered first in 2026, at 53%, and missing or inaccurate data first in 2025, at 50%. The two editions report different samples (204 and 250 respondents), so read that shift with care.
Claim Appeal and Overturn Statistics
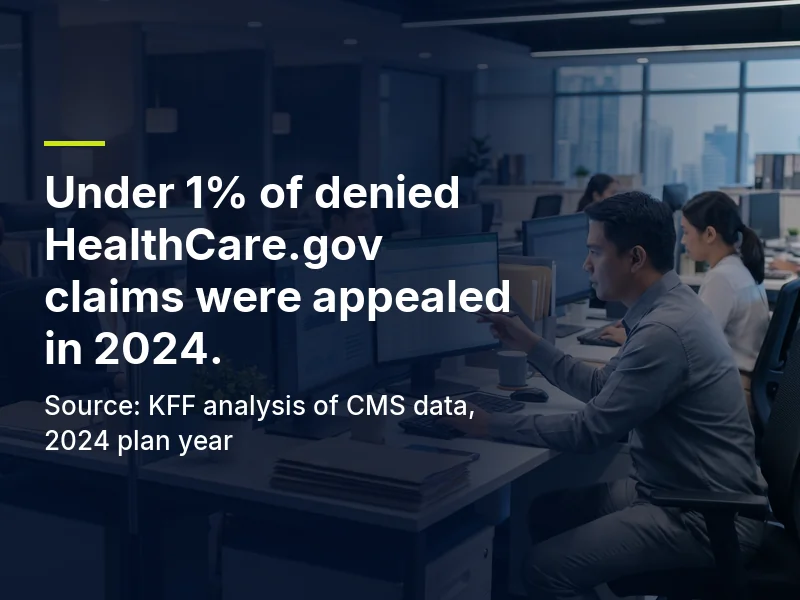
Few denied claims reach an appeal. KFF counted at least 262,982 appealed denials in 2024, under 1% of about 85 million, and 376,508 in 2023, under 1% of 86 million.
| Appeal measure | KFF 2023 | KFF 2024 |
|---|---|---|
| Denials appealed | 376,508 | At least 262,982 (under 1%) |
| Denials upheld | 211,383 (56%) | 165,863 (66% as KFF prints it) |
| External appeals | At least 5,000 | At least 5,881 |
Source: KFF analyses of CMS files, HealthCare.gov plans, 2023 and 2024 plan years. CMS suppresses small values, so counts can understate the true totals.
One figure in the 2024 column needs a note. KFF prints “165,863 (66%)” and repeats 66%, but its own counts give about 63% (165,863 of at least 262,982). KFF does not explain the gap. The 2023 share is consistent at 56%.
Hospital and platform figures read differently. Premier’s survey puts the overturn rate for hospital denials at about 70% (its method uses 68.6%), and a Kodiak executive says payers ultimately pay about 90% of claims. Neither is a national appeal outcome, and neither compares directly with KFF’s counts, which cover ACA plans only.
Many patients are unsure of their rights. In the 2023 KFF Survey of Consumer Experiences with Health Insurance (the page states no sample), 58% of insured adults had a problem using their insurance, 51% were unsure of their appeal rights, and 34% of Marketplace enrollees were aware of the external appeal process. Prior authorization denials follow a separate path; their figures are in the prior authorization appeal statistics.
What Denied Claims Cost to Rework
Premier supplies the only per-claim cost of contesting a denial in this post. Its bed-weighted hospital survey put that cost at $43.84 per claim for 2022 and $57.23 for 2023. The $25.7 billion total for 2023 is Premier’s model, built from 3 billion claims, a 15% denial rate, and $57.23 per claim; Premier also calls nearly $18 billion of that potentially wasted.
| Measure | Figure | Publisher and base |
|---|---|---|
| Cost to contest one denied claim | $43.84 (2022); $57.23 (2023) | Premier, bed-weighted survey |
| Annual cost of contesting denials, 2023 | $25.7 billion (modeled) | Premier’s own method |
| Part of that total potentially wasted | Nearly $18 billion | Premier’s own method |
| Review cycles per denial | An average of three, of 45 to 60 days | Premier, survey |
| Denials reworked with some human review | 90% | Experian, 2025, n=250 |
| Hospital spending on collecting payment | Over $43 billion (estimate) | American Hospital Association (AHA) testimony |
Sources: Premier, Experian, and AHA testimony of March 17, 2026. The AHA figure is an estimate given in testimony, and the report behind it is not cited here.
The AHA’s testimony estimates that hospitals spent over $43 billion in 2025 trying to collect payment insurers owe; that covers collection broadly, not denials alone. Experian’s 90% matters for a different reason: reworking denials still involves people. Technology flags errors and routes work, and staff read the denial, correct the claim, and call the payer.

Pricing for outsourced billing support is covered in the medical billing outsourcing guide, not here.
Administrative Cost of Medical Billing
The CAQH Index is the industry’s recurring measure of administrative transaction cost. Its two latest releases report different measures, so they are shown by edition and not as one trend. The 2024 CAQH Index release of February 11, 2025, reported $90 billion in routine administrative cost and a $20 billion savings opportunity from moving manual work to electronic. The 2025 CAQH Index release of February 19, 2026, reported $258 billion avoided in 2024 and a remaining $21 billion savings opportunity.
| Edition | Release date | Reported figures |
|---|---|---|
| 2024 CAQH Index | February 11, 2025 | $90 billion routine administrative cost; $20 billion savings opportunity |
| 2025 CAQH Index | February 19, 2026 | $258 billion avoided in 2024; $21 billion remaining opportunity; cost avoidance up 17%; medical administrative spend down 9% |
Source: CAQH Index release pages, now served from dataspring.com under a DataSpring byline. CAQH cites 600+ organizations as the base. The data year behind the $90 billion is not confirmed on the release page.
The $90 billion is spending and the $258 billion is cost avoided, so one does not extend the other. Anyone quoting both should name the edition beside each.
Days in AR and Clean Claim Statistics
We found no public benchmark level for the clean claim rate or for days in AR in any source used here. The revenue cycle management statistics in those sources show direction of change, shares of respondents, and platform trends.
| Measure | Figure | Publisher and base |
|---|---|---|
| Change in days in AR | 43% same, 32% higher, 22% lower | MGMA Stat, July 2026, 203 responses |
| Copays collected at service | 72% | MGMA DataDive 2025, base not stated on the public page |
| Other balances collected at service | About 27% | MGMA DataDive 2025, base not stated on the public page |
| True days in AR | Up 5.2% | Kodiak, platform data |
| Collection rate on amounts owed by insured patients | 34.46% (37.58% in 2023) | Kodiak, platform data |
| Respondents saying clean claims are harder than a year ago | 68% (2025); 65% (2026) | Experian, n=250 and n=204 |
Sources: MGMA, Kodiak, and Experian. Kodiak’s 34.46% covers amounts owed by insured patients, not all self-pay balances.
Nearly a third of MGMA respondents saw days in AR rise, and Kodiak’s platform shows true days in AR up 5.2% while collections from insured patients fell. Practices that hand balance follow-up to a dedicated team can read about accounts receivable services.
Medical Billing and Coding Workforce Statistics
The BLS Occupational Outlook Handbook tracks medical records specialists, an occupation that includes medical coders. It is not a count of billers alone, and no federal figure in this post isolates billers.
BLS reports 2025 median pay of $51,140 a year, or $24.59 an hour, and 200,700 jobs in 2025. It projects 8% growth from 2025 to 2035, a change of 15,600 jobs, with about 14,000 openings a year.
Medical Debt and Patient Billing Statistics
The CFPB’s April 29, 2024 release found 15 million Americans with medical bills on their credit reports. Those bills, “in collections,” totaled more than $49 billion. KFF reported in July 2025 that a federal judge had blocked the CFPB’s medical debt credit reporting rule; this post makes no claim about its status since.
Polling shows the worry as well. A KFF Health Tracking Poll reported in July 2025 found 62% of respondents worried about affording care and 61% about unexpected bills. KFF’s page gives no poll date or sample.
Original data on what patients repay comes from a JAMA Health Forum study by Ippolito and colleagues, published August 8, 2025. It analyzed billing data from a revenue cycle management company covering 217 US hospitals and 30.7 million patient episodes. Before the pandemic (January 2018 to February 2020), patients repaid a mean 53.9% of owed cost sharing under private insurance and 54.0% under Medicare Advantage, and repayment declined in more recent years.
Patients paid either 0% or 100% in 92.2% of private-insurance cases and 94.1% of Medicare Advantage cases, so partial payment is rare. Mean liability per person was $375.41 for private insurance and $172.50 for Medicare Advantage. The figures are as the study abstract reports them.
Medical Billing Figures That Are Stale or Untraced
Repetition gives a number reach without adding evidence. Each figure below is traced as far as we could follow it, and the pages that repeat them are not named. On medical billing errors statistics specifically, we could not locate a dataset or method behind the widely repeated 80% figure.
| Figure as repeated | Earliest page found | What it rests on | Use instead |
|---|---|---|---|
| 11.8% MGMA denial rate | Kodiak release of May 21, 2025, which states 11.81% | Kodiak platform data. We opened no MGMA page that states it; DataDive is paywalled, so MGMA cannot be ruled out | 11.81% as Kodiak’s figure, and MGMA’s 7% to 8% separately |
| $25 (or $25.20) to rework a claim | AAFP Family Practice Management, 2015 (“approximately $25”), citing a 2014 MGMA piece; MGMA Stat poll of March 16, 2021 ($25.20) | The 2014 MGMA item was not opened; the $25.20 has no stated method | Premier’s $57.23 per claim for 2023, with its base stated |
| $118 to appeal a denial | MGMA article of December 19, 2018 | Hospital context; its references point to Change Healthcare 2017 | No like-for-like figure; the nearest is Premier’s $57.23 per denied claim |
| 5% to 10% of claims are denied | Origin not located by us | We could not locate a dataset or method | The sourced rates in the reconciliation table above |
| 65% of denied claims are never resubmitted | Physicians Practice, March 6, 2026 (“in 65% of cases, providers never resubmit”). Earlier forms: “more than 50 percent” (AAFP, 2015) and “as many as 60%” (AHIMA Journal, 2022) | A Change Healthcare study cited second-hand; we could not locate the primary | KFF’s appeal counts, which measure appeals on ACA plans, not resubmission |
| 80% of medical bills contain errors | Attributed to the Medical Billing Advocates of America (MBAA). The page we found, a Wikipedia entry on medical-bill advocacy, says “as many as 9 out of 10” and does not state 80% | We could not locate a dataset or method for either figure | No replacement: this post holds no sourced error-prevalence figure |
| 86% of denials are avoidable | MGMA Stat poll of March 16, 2021 | A Change Healthcare executive’s statement, relayed, with no method | No like-for-like figure; KFF’s reason shares show why insurers denied claims, not whether a denial was avoidable |
| $19.7 billion spent overturning denials | Premier, 2022 claims | A prior-year figure that Premier published beside $25.7 billion | Premier’s $25.7 billion, labeled as modeled |
| 75% of Medicare Advantage denials are overturned on appeal | HHS Office of Inspector General report of September 25, 2018, covering 2014 to 2016 data | Medicare Advantage only, and data from 2014 to 2016 | Premier’s about 70% for hospitals and KFF’s ACA counts, each on its own base |
| US medical billing market size | Grand View Research’s US medical coding market estimate: $21.6 billion in 2025 | A vendor model of the coding market, not billing, with no named primary source | No market-size figure is published here; BLS employment is the sourced size measure |

Figures in this table are not counted among the 59. Quoted wording is as the earliest page prints it.
Three of the ten rows (the $118, the 86%, and the 65%) rest on or point to Change Healthcare material relayed by other publishers. The earliest page for four rows is dated 2021 or earlier. A reader who meets any of these without a year cannot tell how old it is.
Who Handles the Work Behind These Medical Billing Figures
Behind each denial, rework, and AR figure above is staff time: checking eligibility before a visit, scrubbing claims before submission, following up on denials, and calling payers about unpaid balances. Digital Minds BPO provides office-based, HIPAA-trained teams in Naga City, Philippines, who do that work through its medical billing services. Technology supports those staff by flagging errors; people still make the calls.
The company publishes no denial, appeal, or collections results, and nothing in this post predicts how a payer will rule. Practices weighing who should own front-end work can also read the patient no-show statistics and the prior authorization services page.
FAQ: Medical Billing Statistics
What percentage of medical claims are denied?
It depends on what is counted. KFF found 19% of in-network claims and 20% of all claims denied on HealthCare.gov plans for 2024. Premier’s hospital survey reports nearly 15%, Kodiak reports an initial denial rate of 11.81% on its platform, and MGMA reports first-submission denials of 8%. Experian’s 40% is the share of survey respondents reporting denial rates of 10% or higher, not a claim denial rate.
What are the most common reasons for claim denials?
KFF’s 2024 data lists “other” at 36% of reported in-network denial reasons, administrative reasons at 25%, excluded services at 13%, and medical necessity at 5%. In Experian’s 2026 survey of 204 healthcare staff, services not covered ranked first (53%), ahead of changing payer policies (31%) and code inaccuracy (25%). KFF reports insurer reasons and Experian reports what respondents say, so the two lists differ.
How much does it cost to rework a denied claim?
Premier’s hospital survey puts the cost of contesting a denied claim at $57.23 for 2023, up from $43.84 for 2022. We could not confirm a method for the older $25 figure, which AAFP credits to a 2014 MGMA item, or for the $118 figure in a 2018 MGMA article. Premier’s $25.7 billion annual total is a modeled estimate.
What percentage of denied claims are appealed, and how many are overturned?
KFF counted at least 262,982 appealed denials in 2024, under 1% of denials, and 165,863 were upheld (66% as KFF prints it; about 63% on the counts shown). Premier’s survey of 280 hospitals reports about 70% of hospital denials overturned. KFF covers ACA plans and Premier covers hospitals, so the two do not combine into one national rate.
Do 80% of medical bills contain errors?
We could not locate a dataset or method behind that figure. The page we found attributes a similar claim to the Medical Billing Advocates of America, and it says “as many as 9 out of 10” rather than 80%. A sourced denial reason, such as KFF’s 25% administrative share for 2024, measures something different from errors on a bill.

Sofia Reyes is a Content Writer and SEO Specialist at Digital Minds BPO, where she focuses on outsourcing-industry research and educational content for business decision-makers. Based in the Philippines, she has 7 years of experience writing B2B content across SEO, content strategy, and Generative Engine Optimization (GEO). Sofia partners with Digital Minds BPO’s operations and account management teams to translate 15+ years of frontline BPO experience into clear, sourced guides on call center, customer service, and back-office outsourcing. Her work supports prospects evaluating outsourcing decisions across the company’s three dedicated facilities, where the team delivers a 94% client retention rate for clients ranging from Fortune 500 enterprises to growth-stage businesses.