Have you ever called a company’s hotline and felt that gush of relief when someone answers and asks, “How may I help you today?” After a few exchanges, your issue is resolved, and you walk away with a positive impression of the brand. That is the power of a great call center experience.
The role of call centers continues to grow as we move into 2026. With the rise of AI-powered tools, omnichannel communication, and increasingly high customer expectations, staying ahead requires more than just answering the phone. It requires understanding the latest industry data, knowing what your customers expect, and continuously improving your operations.
If you’ve read our previous list of call center statistics, we’ve gathered new data and updated trends to create this comprehensive 2026 edition. Here are 40+ call center statistics that can help you understand customer expectations and enhance your call center performance.
What Are the Most Important Call Center Statistics for 2026?
The global contact center market was valued at approximately $352.4 billion in 2024 and continues to grow at a 6.0% compound annual growth rate. Customer satisfaction remains the top priority for 95% of contact center professionals, while the call center AI market reached $2.41 billion in 2025. Despite advances in automation, 90% of customer interactions still require skilled human agents in 2026, making agent quality and training more important than ever.
What Is a Call Center?
A call center is a centralized hub that handles customer support services and brings a brand closer to its consumers. They can function either as outbound or inbound call centers, or both. Companies like Digital Minds BPO, a Philippine-based business process outsourcing company with over 15 years of experience, operate call centers that connect brands with their customers across multiple channels.
Call centers are part of a broader group of contact centers that may include other channels. Different types of contact centers include phone support, live chat, email, and other websites and applications. Today, over 75% of call center organizations and outsourcing companies offer omnichannel capabilities that provide customers with a positive experience.
The importance of call centers lies in their function to enhance customer experience. This remains to be one of the most essential call center priorities, with 95% of contact center professionals ranking it as their top metric.
Look into these key call center statistics to stay up-to-date and ready to enhance your business’ efficiency.
Call Center Industry and Market Statistics
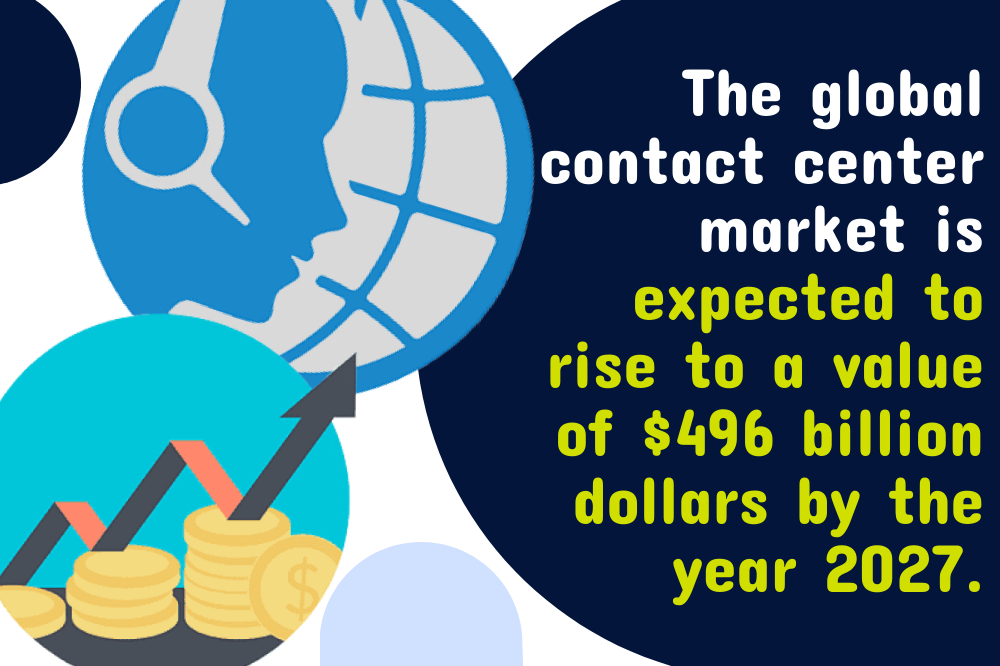
1. The global contact center market was valued at approximately $352.4 billion in 2024 and is expected to grow to $500 billion by 2030, at a compound annual growth rate of 6.0%.
Contact center operations are bound to become one of the most productive and profitable sectors in the world, with experts projecting its tremendous growth annually. This growth is driven by increasing customer expectations and the expanding role of customer service in brand differentiation.
2. The contact center software market reached $63.88 billion in 2025 and is projected to grow to $263.75 billion by 2034, at a 16.5% CAGR.
Investment in call center technology is accelerating rapidly. More and more businesses are prioritizing tools that improve agent productivity, streamline workflows, and deliver data-driven insights for better customer outcomes.
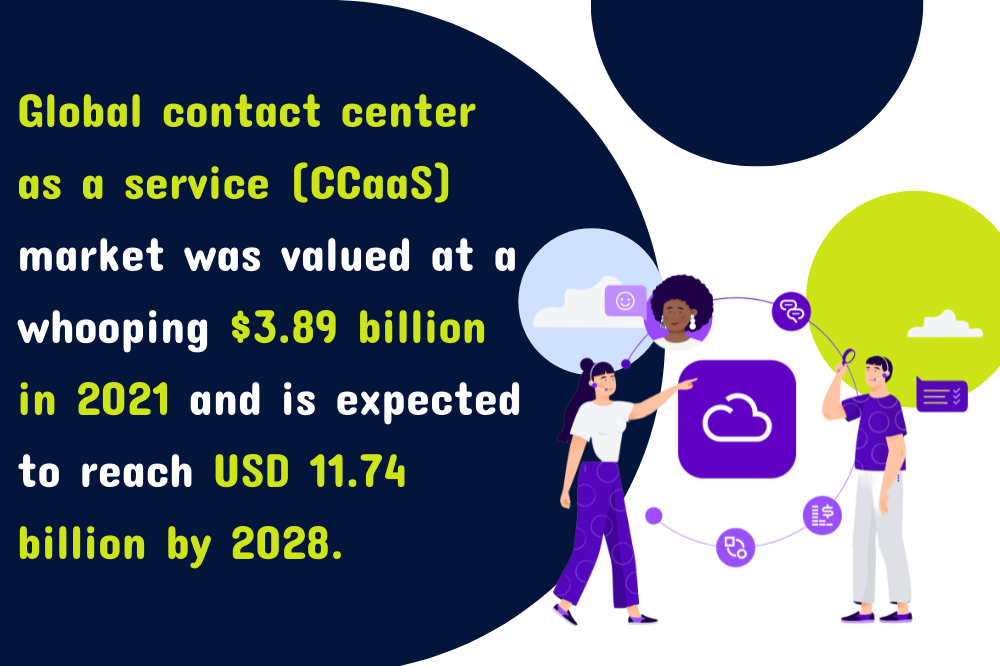
3. The global CCaaS (Contact Center as a Service) market was valued at $7.08 billion in 2025 and is projected to reach $30.15 billion by 2034, at a 17.4% CAGR.
Call center leaders are turning to CCaaS to provide omnichannel support. These cloud-based solutions offer scalability, flexibility, and lower upfront costs compared to traditional on-premise solutions, making them particularly attractive for growing companies.
4. The cloud-based contact center market was valued at $34.66 billion in 2025 and is growing at a remarkable 23.9% CAGR.
Cloud infrastructure is quickly becoming the backbone of modern call centers. The shift to cloud-based solutions allows businesses to scale their operations faster, reduce downtime, and provide agents with access to the tools they need from anywhere.
5. The call center industry standard is answering 80% of calls in 20 seconds.
Efforts are being made to improve those numbers to 90% within 15 seconds. Meeting or exceeding this benchmark is a strong indicator of operational efficiency and directly impacts how satisfied your customers feel with your service.
6. The call center’s benchmark for an average cost per call for every customer is $2.70 to $5.60.
Looking into any steady rise or spike in this metric should help you navigate your business’ expenses accordingly. Keeping your cost per call within this range while maintaining high quality is one of the key balancing acts in call center management.
7. Global call centers employ over 13 million people, with the U.S. call center workforce totaling 3.8 million and growing at 2.5% annually.
The call center workforce remains one of the largest employment sectors globally. Despite the rise of automation, the demand for skilled human agents continues to grow, reflecting the ongoing need for empathetic and personalized customer support.
8. A call center receives an average of 4,400 calls per month, with 48 missed calls.
This volume highlights just how critical it is for call centers to be properly staffed and equipped. Every missed call is a missed opportunity to resolve an issue, retain a customer, or close a sale. Proper workforce planning helps ensure your team can handle the demand.
Customer Experience Statistics That Drive Loyalty
9. Around 95% of customers say that having a great customer service experience makes them more likely to purchase again.
A business’ customer service is as important as its product. This is why customer satisfaction scores are really important in determining whether a business is capable of providing excellent service to its customers.
10. 1 in 3 customers will leave a brand after one bad experience, and 92% of customers will completely abandon a company after two to three negative experiences.
Customers can be very lenient when it comes to the quality of their experiences. But there’s also a significant portion of the consumer population that tends to switch brands after a single unpleasant experience. Consistency in service quality is key to keeping your customers loyal.
11. Businesses lose approximately $1.6 trillion per year due to poor customer service.
The financial impact of poor call center performance extends far beyond individual interactions. When customers leave due to bad service, they take their lifetime value with them and often share their negative experiences with others, compounding the revenue loss for your business.
12. In 2023 data, 56% of consumers become repeat buyers after a personalized experience.
Customer loyalty is becoming increasingly important to companies, especially with the growing number of competitors in every industry. To keep customers loyal to your company, customizing your service to cater to their expectations is key.

13. 69% of business leaders are investing in personalization despite economic uncertainty.
This shows how much businesses value the role of great customer service in the industry. Establishing connections and a more customized approach shows how much a business values its customers. This translates to loyal clients who stick around for the long term.
14. 40% of consumers are willing to walk away after a single poor customer service experience.
With more options available than ever, customers have little patience for subpar service. This makes first-contact quality and agent preparedness critical for every call center interaction. Getting it right the first time is no longer a bonus; it’s a necessity.
15. 95% of contact center professionals consider customer satisfaction as the most important call center metric.
Every call center aims to deliver the highest level of satisfaction to its customers. It’s no surprise that customer satisfaction tops the list of the most important contact center metrics that businesses prioritize. Every other metric should ultimately support this goal.
16. 71% of consumers expect personalized interactions, and 76% get frustrated when they don’t receive them.
Personalization has become a baseline expectation, not just a nice-to-have. Call centers that leverage customer data to tailor interactions, from greeting returning customers by name to referencing past purchases, consistently outperform those that treat every call as a first-time interaction.
What Customers Expect From Call Centers in 2026
17. 71% of customers expect businesses to already know why they are calling.
Customers want to be understood. Once they reach out to you, they expect you to have an idea of how to help them without being redirected to other agents or departments.
18. 53% of customers have to repeat their reason for calling to multiple agents.
It is important for call centers to have the basic information of their customers to be capable of providing the assistance that they need. Many call centers use customer relationship management (CRM) systems to organize and manage their customer data so agents don’t have to ask the same questions twice.
19. 79% of callers get rerouted at least once.
With a high percentage of calls getting rerouted, contact centers are implementing intent-based call routing technology to improve performance. When calls are routed correctly the first time, customers get faster resolutions and agents can focus on issues within their expertise.
20. Inbound voice jumped to 55.4% in 2023 from 53.5% in the previous year, showing voice support remains the preferred channel.
Voice support continues to be the preferred contact center channel despite the adoption of digital channels. This channel is most effective in resolving complex issues and handling customers with more empathy and understanding.
21. Latest call center statistics show that around 28% of customers that are placed on hold drop the call after 5 minutes or less.
This goes along with the average time it takes for agents to answer calls, which is 30 seconds to 2 minutes. Contact centers measure the average waiting time to make sure that all customer queries are properly and promptly handled. Being mindful of these call center metrics also improves overall contact center efficiency.
22. Around 45% of customers say that they feel annoyed or upset when they are kept in the queue for 5 to 15 minutes.
In a study by American Express, two-thirds of consumers would accept hold times of less than two minutes, and 13% said that there should be no hold times at all. Call centers that provide accurate wait time estimates and offer callback options can reduce this frustration significantly.
Timely and accurate responses have always been an integral component of every customer’s contact center experience. And with the availability of new call center technologies and social media platforms, consumers expect more streamlined processes across all channels.
24. 75% of customers prefer self-service options for simple inquiries.
For basic questions like account balance checks or order tracking, most customers prefer handling things themselves through IVR systems, knowledge bases, or chatbots. This frees up your human agents to focus on complex issues where their skills and empathy are most needed.
How Technology and AI Are Shaping Call Centers in 2026
25. The call center AI market was valued at approximately $2.41 billion in 2025 and is projected to reach over $10 billion by 2032, at a 22.7% CAGR.
AI is making its way into every corner of the industry. The most successful implementations use AI to enhance agent capabilities through real-time suggestions, automated call summaries, and intelligent routing, helping human agents deliver even better service.
26. 92% or more than 9 in 10 companies are investing in AI-driven personalization to support their customer service.
The adoption of AI increases their efforts towards personalization. It also increases efficiency and provides more accurate responses. With AI analyzing customer data in real time, agents get the context they need to deliver more relevant and empathetic support.
27. Even with rapid AI advances, 90% of customer interactions still require human agents in 2026, according to Gartner projections.
While AI handles routine inquiries effectively, the vast majority of customer interactions, especially complex or emotionally sensitive situations, still depend on skilled human agents. The ability to listen, empathize, and think critically remains irreplaceable in delivering exceptional customer experiences.
28. 85% of call center managers are likely to implement a conversation intelligence solution in the next year.
Conversation intelligence platforms analyze call recordings to identify trends, coaching opportunities, and customer sentiment patterns. These tools help managers improve agent performance and customer outcomes without adding to agent workload.
29. Around 60% of customer service agents say that AI helps them save time in routing calls and processing inquiries.
Every call answered is an opportunity for businesses to deliver great service. With the help of AI, call center agents can handle more calls efficiently and focus their energy on what matters most: solving customer problems and building relationships.
30. Predictive analytics improve call center efficiency and productivity by 60%.
For a more proactive approach, call center operations have turned to using statistics, historical data, and modeling techniques to predict possible outcomes. Businesses use these tools to predict peak call times and hold times, and to route calls to agents who can best handle specific needs.
31. Speech analytics software is growing rapidly at 22.14% CAGR, with the market valued at over $5 billion.
Using AI to manage data from customer interactions, inquiries, order tracking, returns, and other forms of support can be done simultaneously. This technology enables call centers to gain insights from every conversation and identify areas for improvement across the entire operation.
32. 66% of call centers are looking to invest in advanced analytics to improve customer service.
As data becomes increasingly central to call center operations, the majority of organizations are prioritizing analytics investments. These tools help identify patterns in customer behavior and agent performance that would be invisible without data-driven insights.
33. 60% of failed First Contact Resolution attempts are due to an agent’s inability to access the correct data.
Data management plays a crucial role in every call center. When agents don’t have access to the right data at the right time, customers can become frustrated. Investing in proper CRM systems and knowledge bases helps agents resolve issues on the first call.
Call Center Workforce and Turnover Statistics
34. Annual employee turnover in call centers runs at 40 to 45% in 2025, nearly 3 times higher than the average for all other occupations.
Call centers as a whole have become a constant subject of discussions about high turnover rates. The constant cycle of recruiting, hiring, and training new agents puts significant strain on operational budgets and service quality. Organizations that prioritize employee engagement and career development tend to see substantially lower attrition rates.
35. The average call center employee stays on the job for just 14.3 months.
With such short average tenure, call centers face a constant challenge of maintaining institutional knowledge and service consistency. Investing in comprehensive onboarding programs, clear career progression paths, and supportive work environments can help extend agent tenure and improve service quality.
36. Replacing a single call center agent costs an average of $10,000 in recruitment, onboarding, and retraining.
When you factor in recruiting expenses, training time, reduced productivity during the learning curve, and the impact on team morale, retaining experienced agents becomes one of the most cost-effective strategies a call center can pursue.
37. 86% of call center agents feel that they don’t have adequate and proper resources to effectively deal with customers.
Personalizing customer experiences and increasing close rates are paramount to giving each customer a pleasant contact center experience. With this, call centers are encouraged to adopt the use of conversation intelligence data and proper agent enablement tools.
38. 50% of call center managers revealed that they didn’t have enough automation in their call centers.
Despite AI and automation’s recorded active use worldwide in 2026, a significant percentage of call center managers still believe that they don’t have enough of these technologies to enhance their call center performance. The gap between available technology and actual implementation remains a real challenge.
39. Roughly 20% to 30% of call volume is about unresolved customer issues.
Unresolved customer issues are indicative of a call center’s inefficiency. When unresolved issues pile up, call centers should implement a ticketing system to effectively track and monitor unresolved customer concerns and reduce repeat calls.
40. 49% of business owners said that they use a call center software or a call center knowledge base.
More and more business owners are investing in creating knowledge bases to enhance productivity and encourage self-service customer support. These tools help both agents and customers find answers faster, improving efficiency across the board.
Essential Call Center Performance Metrics for 2026
Call center metrics and KPIs help you look into data from all the contact center solutions and employee strategies you use to operate. Analyzing these based on performance standards allows you to gauge your level of efficiency and effectiveness, as well as the areas you can improve. Here is a summary of the key benchmarks:
| Metric | Industry Benchmark | What It Measures |
|---|---|---|
| Customer Satisfaction (CSAT) | 75-84% | Customer happiness with service received |
| First Call Resolution (FCR) | 70-75% | Issues resolved on first contact |
| Average Handle Time (AHT) | 6 min 3 sec | Duration per customer interaction |
| Net Promoter Score (NPS) | 20%+ | Likelihood of customer referral |
| Call Abandonment Rate | 12-20% | Callers who hang up before being answered |
| Occupancy Rate | 80-85% | Agent time spent actively handling customers |
Customer Satisfaction (CSAT)


Customer satisfaction, or CSAT, is an important performance metric in measuring if your customer is happy with their experience with your business. A high rate in CSAT indicates customer satisfaction, while a lower rate may indicate areas that need to be improved. The call center performance standard for a good CSAT score is around 75% to 84%. Conduct survey feedback to look into points for improvement and identify patterns in your customer interactions.
First Call Resolution (FCR)

The FCR metrics help measure the number of customer concerns resolved on the first call. This indicates the capability of a call center agent to provide immediate solutions to their client’s needs. Generally, call centers achieve an FCR rate of 70 to 75%. This is considered ‘good’, while global call centers usually reach 80%. Improve your FCR by providing access to knowledge improvements and enhancing the quality of customer support through training programs.
Average Handle Time (AHT)
This metric tracks the time it takes for every customer interaction. This provides information on how efficiently a call center agent can provide support without sacrificing quality. A good average call duration is 6 minutes and 3 seconds. But take note that this depends on the type of call center and how complex the customer support demands. Improving call center AHT is possible by investing in additional tools and optimizing workflows.
Net Promoter Score (NPS)
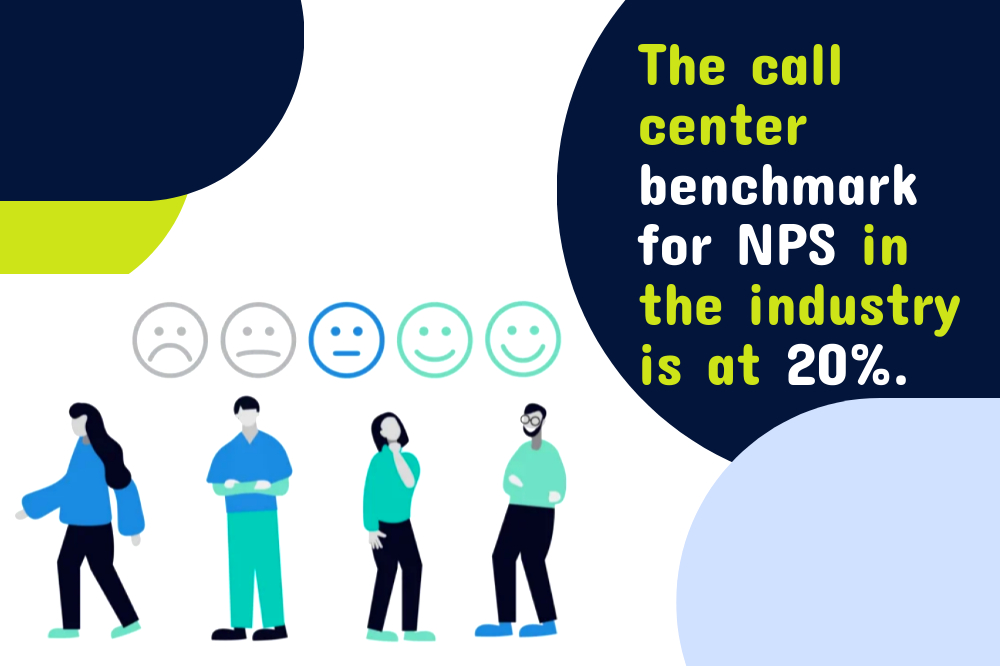
An NPS indicates the probability of customers recommending your product or service to other people and circles. This considers the service satisfaction and loyalty of a customer, as well as the brand image. The call center benchmark for NPS in the industry is at 20%. Anything above 0 is good; anything below 0 is an indication for adjustment and improvement. To calculate this, subtract the percentage of detractors (score 0-6) from promoters (score 9-10).
Call Abandonment Rate
The call abandonment rate measures the number of customers who hang up before their call is answered by an agent. A low call abandonment rate indicates customers are confident in your service. The average call center abandonment rate is 12 to 20%. Improve this metric by providing more accurate wait times, optimizing call routing, and improving customer service channels.
Occupancy Rate
Occupancy rate is the percentage of time call center agents spend handling customers. This call center metric evaluates how much of a contact center agent’s total available time is spent on taking calls, chatting, or writing emails to clients. A healthy target is 80 to 85%. When the occupancy rate is high, this indicates agents are maximizing their time. Rates above 90% can lead to burnout.
Call Arrival Rate
The call arrival rate measures the number of calls that a call center receives within a certain unit of time. This metric evaluates the staffing needs of a business. If many calls are put on hold and dropped, then there may be an insufficient number of agents. The target is to meet operational efficiency to support call center teams to handle customers well.
What Our 15 Years in Call Center Operations Has Taught Us
At Digital Minds BPO, we’ve operated call centers for over 15 years across dozens of industries. The statistics above tell an important story, but there are lessons that only come from hands-on experience managing thousands of customer interactions every day.
Agent quality matters more than agent quantity. We’ve seen firsthand that a well-trained, motivated team of call center agents consistently outperforms a larger team that lacks proper support and development. Every metric on this list (CSAT, FCR, AHT, NPS) improves when you invest in the people answering the phones. Our 92% client retention rate and average 4.7-year partnership duration reflect this approach.
Technology should enhance human capabilities, not replace them. The most effective call centers we’ve built combine skilled agents with the right tools. AI handles data lookup and call routing so agents can focus on listening, problem-solving, and building genuine connections with customers. Clients who treat their call center teams as an extension of their brand, rather than just a cost center, consistently see better satisfaction scores and longer customer relationships.
Use These Call Center Statistics to Drive Better Performance in 2026
Call center future trends are crucial to improve processes and help call center companies succeed in their respective fields. When plans and strategies are based and aligned on these stats and trends, it becomes easier for companies to adapt to the ever-changing needs and demands of their target markets.
Enhancing productivity and continuously providing prompt and efficient support to clients is a proven way to maintain valuable relationships with clients and other stakeholders. The key takeaway from these 2026 statistics is clear: invest in your people, equip them with the right technology, track the metrics that matter, and never lose sight of the customer experience. Companies that get this balance right will be the ones that build lasting customer loyalty and sustainable growth.
Frequently Asked Questions About Call Center Statistics
What is the average call center turnover rate?
Annual call center turnover runs at 40 to 45% in 2025, nearly three times higher than the average for other occupations. The average agent stays on the job for about 14.3 months. This makes retention strategies, competitive compensation, and career development programs critical for maintaining service quality and reducing the estimated $10,000 cost of replacing each agent.
What are the most important call center metrics to track?
The most critical metrics include Customer Satisfaction (CSAT, benchmark 75-84%), First Call Resolution (FCR, benchmark 70-75%), Average Handle Time (AHT, benchmark 6 minutes 3 seconds), and Net Promoter Score (NPS, benchmark 20%+). Among these, 95% of contact center professionals rank customer satisfaction as the single most important metric to track.
How is AI changing the call center industry?
AI is enhancing call center operations through conversation intelligence, predictive analytics, and automated call routing. The call center AI market reached $2.41 billion in 2025 and is growing at 22.7% CAGR. However, 90% of customer interactions still require human agents, particularly for complex or emotionally sensitive situations. The most effective approach combines AI-powered tools with skilled human agents.
How big is the global call center market?
The global contact center market was valued at approximately $352.4 billion in 2024 and is projected to reach $500 billion by 2030, growing at a 6.0% CAGR. The CCaaS segment alone was valued at $7.08 billion in 2025, while the contact center software market reached $63.88 billion. These figures reflect the industry’s continued expansion and importance to global business operations.
What is a good customer satisfaction score for a call center?
The industry benchmark for a good CSAT score is 75% to 84%. Scores above 84% are considered excellent, while scores below 75% indicate significant room for improvement. The U.S. overall ACSI (American Customer Satisfaction Index) stood at 77.0 in Q1 2025. Improving CSAT requires a combination of agent training, efficient call routing, and consistent quality assurance practices.
Improve Your Call Center Performance with Digital Minds BPO
If you want to create more valuable relationships with your clients, Digital Minds BPO has got you covered. With over 15 years of experience and three dedicated facilities, we offer a wide range of call center solutions that will help you gain a competitive advantage in your business. We specialize in telemarketing, appointment setting, inbound call center services, virtual receptionist services, and more. Contact us today, and let’s start building your dreams!