These 81 sourced help desk statistics for 2026 each name the publisher, the year of the data, and the type of data behind the number: vendor platform data, a benchmark database, or government statistics. A final section lists 14 widely repeated help desk figures that fail a source check, with the origin of each where we could find one.
The central finding is that one help desk metric can carry two different numbers without either being wrong. Freshservice’s 2025 platform data puts customer satisfaction at 97.83% across IT and business-team tickets, and MetricNet’s 2023 benchmark puts voice satisfaction at 81.1%. The two come from different datasets measured in different ways, so both numbers can stand. Digital Minds BPO, a business process outsourcing company in Naga City, Philippines, compiled this list from third-party sources; none of the figures describes Digital Minds BPO’s own operations.
Help Desk Statistics 2026: Key Takeaways and Service Desk Benchmarks
Ten figures carry most of the weight in any set of help desk metrics. Each row names the publisher, the year, and the data type; the sections below define each metric before giving its number.
| Figure | Source, year | Data type |
|---|---|---|
| Service desk net first-level resolution of 78.9% and net first contact resolution of 70.2% | MetricNet, 2023 | Benchmark database |
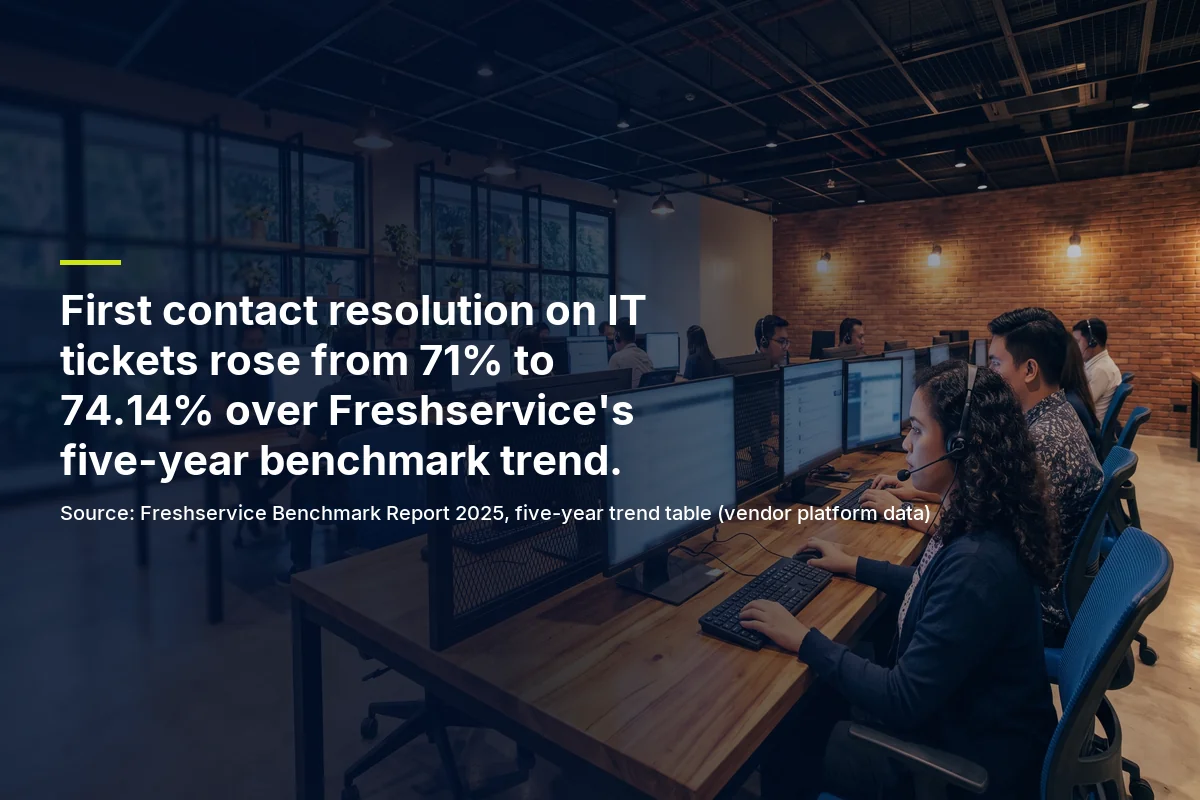
| First contact resolution of 74.14% on IT tickets, up from 71% in 2021 | Freshservice Benchmark Report, 2025 (157.8M IT tickets, 2024 data) | Vendor platform data |
| Cost by support level, North America: $2 self-help, $22 Level 1, $69 Level 2, $104 Level 3, $221 field, $599 vendor | HDI SupportWorld, 2017 | Benchmark database |
| Cost per analyst-assisted contact of $20.61 (median $16.50), against $22.56 in 2010 | MetricNet, 2023 | Benchmark database |
| Cost per ticket by channel in North America, from $2.37 for self-help to $37.52 for walk-up | HDI SupportWorld, 2021 | Benchmark database |
| IT ticket resolution time of 21.96 business hours and first response time of 9.36 business hours | Freshservice, 2025 | Vendor platform data |
| Resolution SLA rate of 96.16% on IT tickets | Freshservice, 2025 | Vendor platform data |
| Customer satisfaction of 81.1% on voice contacts (MetricNet) against 97.83% across IT and business-team tickets (Freshservice) | MetricNet, 2023; Freshservice, 2025 | Benchmark database; vendor platform data |
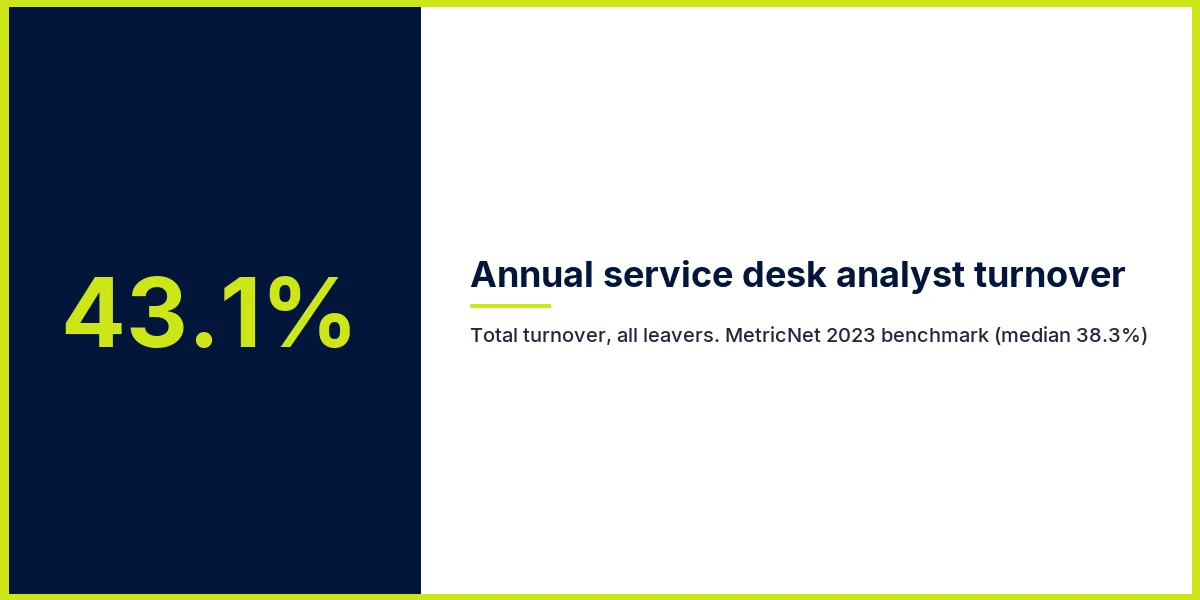
| Annual analyst turnover of 43.1% (median 38.3%), counting every agent who leaves | MetricNet, 2023 | Benchmark database |
| 903,100 computer support specialist jobs in 2025, projected to decline 3% from 2025 to 2035 | US Bureau of Labor Statistics, Occupational Outlook Handbook | Government statistics |
Figures are as published unless marked as our calculation. Samples, definitions, and caveats appear in the sections that follow.
How We Sourced These Numbers
Every figure was read at the publisher’s own document or page in October 2026. Each source carries one of three grades.
- Grade A, disclosed sample or method. The publisher states who or what was measured, or how the measure is built.
- Grade B, publisher figure, sample not disclosed. The figure is printed with a definition, but not the size of the group behind it.
- Grade C, convention with no study. A number repeated as a rule of thumb. No Grade C figure appears in the body; figures of this kind went to the audit section.
| Data type | Used here | Grade | Main limit |
|---|---|---|---|
| Vendor platform data | Freshservice Benchmark Report 2025 (data from January to December 2024) | A | Describes Freshservice customers, not all help desks; times are in business hours |
| Benchmark database | MetricNet 2023 Benchmarking Roundup; HDI SupportWorld articles from 2017, 2018, and 2021 (written by MetricNet’s Jeff Rumburg) | B (A for the 2018 turnover chart) | Same database family, so the four are not independent confirmations of each other |
| Government statistics | US Bureau of Labor Statistics, Occupational Outlook Handbook | A | US data for a job category wider than help desk work |
The three data types in this post. Each statistic is labeled with its type where it appears.
MetricNet draws on data from 19 countries and a database of 4,000+ benchmarks built over 30 years, yet its 2023 deck does not state the size of the peer group behind its figures. Freshservice’s 2025 report covers 187M+ tickets from 10,743 organizations in 118 countries; the IT-only figures used here come from 157,750,405 tickets and 10,551 organizations.
The Freshservice report labels its figures “average,” and also says each KPI is a composite benchmark “based on median performance globally.” We print the figures as the report states them and flag the ambiguity here instead of choosing a label for it.
The count of 81 gives each distinct measured quantity one count. A figure reported with its median, range, or prior-year value is one finding, a multi-year trend counts as its latest figure, and our own arithmetic is not counted. Contact center KPI figures sit in our call center benchmarks audit, which uses the same grading.
First Contact Resolution Rate Statistics
The first contact resolution rate travels under four terms in this dataset, and a number is only usable once you know which one it is. HDI’s 2017 article separates gross from net first-level resolution, and MetricNet reports both first-level resolution and first contact resolution.
| Term | What it counts | Basis |
|---|---|---|
| First contact resolution (FCR) | Tickets resolved on the user’s first contact, with no follow-up | Reported separately by MetricNet 2023 and Freshservice 2025 |
| First-level resolution (FLR) | Tickets resolved at Level 1 without escalation | HDI 2017; MetricNet 2023 |
| Net FLR | Tickets resolved at Level 1, divided by the tickets that could be resolved at Level 1 | HDI 2017 |
| Gross FLR | Tickets resolved at Level 1 as a share of all tickets (our reading of the gross-versus-net distinction) | HDI 2017 |
Only the net FLR definition is quoted from HDI. A net rate reads higher than a gross rate on the same desk.
| Measure | Figure | Source, year | Data type |
|---|---|---|---|
| Service desk net first-level resolution | 78.9% (median 80.1%) | MetricNet, 2023 | Benchmark database |
| Service desk net first contact resolution | 70.2% (median 68.4%) | MetricNet, 2023 | Benchmark database |
| Chat first contact resolution | 62.3% | MetricNet, 2023 | Benchmark database |
| Desktop support incident first contact resolution | 68.8% | MetricNet, 2023 | Benchmark database |
| First contact resolution on IT tickets | 74.14% | Freshservice, 2025 | Vendor platform data |
| First contact resolution on business-team tickets | 79.53% | Freshservice, 2025 | Vendor platform data |
| First contact resolution on the phone channel | 91.23% | Freshservice, 2025 | Vendor platform data |
| Global average first-level resolution (dated) | 74.3% (range 37.6% to 97.8%) | HDI SupportWorld, 2017 | Benchmark database |
| First-level resolution with a remote-control tool, against without (dated) | 77.8% against 61.4% | HDI SupportWorld, 2017 | Benchmark database |
MetricNet’s 2023 deck does not state its sample size. The phone figure covers only tickets that arrived by phone.
MetricNet’s 2023 deck puts net first-level resolution at 78.9% and net first contact resolution at 70.2%, so about 21% of tickets that a Level 1 analyst could resolve still pass upward (our calculation). Freshservice’s 2025 report lands in the same area for IT tickets at 74.14%, but on a different base, so the two figures sit close together without measuring the same thing.
| Trend | Earlier point | Latest point |
|---|---|---|
| MetricNet net first-level resolution | 73.5% (2010) | 78.9% (2023) |
| MetricNet net first contact resolution | 67.9% (2010) | 70.2% (2023) |
| Freshservice IT first contact resolution, 2021 to 2025 | 71% (2021) | 74.14% (2025) |

MetricNet, 2023 deck (benchmark database); Freshservice, 2025 report (vendor platform data). Freshservice’s 2022 to 2024 values are 70%, 72%, and 73.9%.
Thirteen years of MetricNet data show net first-level resolution rising 5.4 points (our calculation), while desktop first-visit resolution fell from 78.2% in 2010 to 68.8% in 2023. Service desk resolution improved and desktop resolution worsened in the same dataset. HDI’s 2017 data also splits desks by tooling: those with a remote-control tool resolved 77.8% at Level 1, against 61.4% without one.
Help Desk Cost per Ticket Statistics
MetricNet defines cost per ticket as total operating expense divided by ticket volume. That makes it a fully loaded figure: salaries, technology, facilities, and overhead all sit in the numerator. A per-seat price quoted by a provider is a different quantity, so dividing a quote by ticket count does not reproduce a MetricNet number. Our guide to what help desk outsourcing costs covers the pricing side.
The most citable cost figures in this post are HDI’s 2017 North American costs by support level, fully loaded. We call this the support-level cost ladder, and each step up adds cost.
| Support level | Cost per ticket, North America | Source, year |
|---|---|---|
| Self-help | $2 | HDI SupportWorld, 2017 |
| Level 1 service desk | $22 | HDI SupportWorld, 2017 |
| Level 2 desktop support | $69 | HDI SupportWorld, 2017 |
| Level 3 IT | $104 | HDI SupportWorld, 2017 |
| Field support | $221 | HDI SupportWorld, 2017 |
| Vendor support | $599 | HDI SupportWorld, 2017 |
Benchmark database. These 2017 figures are stale for budgeting; they show the shape of the ladder, not today’s prices.
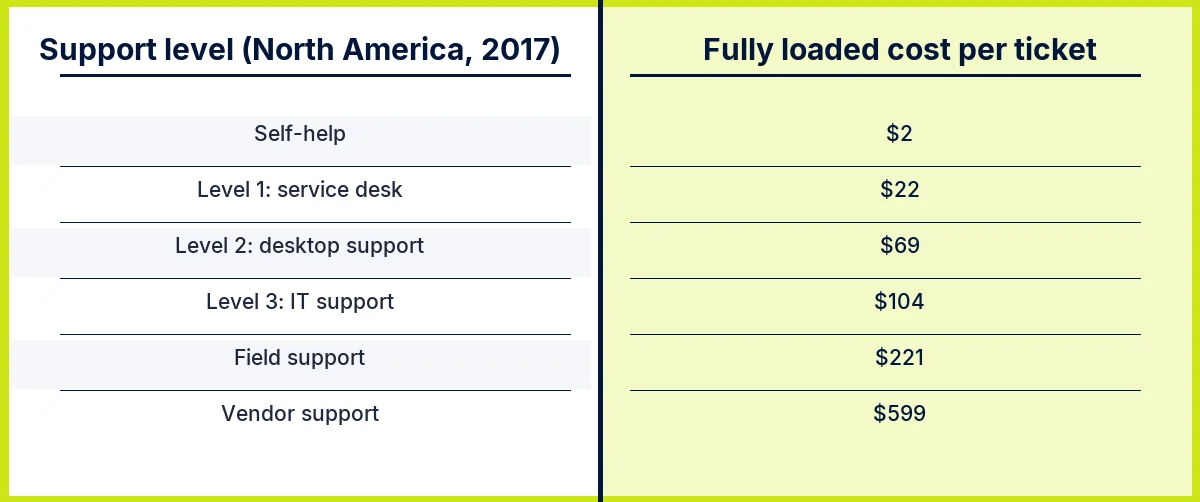
A vendor-supported ticket at $599 costs about 300 times a self-help ticket at $2 (our calculation), which is why first-level resolution carries a price as well as a satisfaction effect.
HDI’s 2021 article, updated in October 2024, reports cost per ticket by channel for North America, with the range across desks in brackets.
| Channel | Average cost per ticket | Range across desks |
|---|---|---|
| Walk-up | $37.52 | $19.81 to $104.68 |
| Voice | $17.19 | $7.04 to $40.94 |
| $16.13 | $6.29 to $32.40 | |
| Chat | $15.72 | $5.92 to $36.33 |
| Web submit | $15.07 | $5.46 to $29.57 |
| Self-help | $2.37 | $0.74 to $4.18 |
HDI SupportWorld, 2021 (Figure 5, read from the chart image); benchmark database. Voice, email, chat, and web submit sit within $2.12 of each other (our calculation).
MetricNet’s 2023 deck gives the newer service desk view, again by channel.
| Measure, 2023 | Figure | Context |
|---|---|---|
| Cost per analyst-assisted contact | $20.61 | Median $16.50; range $5.91 to $56.00; $22.56 in 2010 |
| Voice | $18.35 | Per analyst-assisted voice contact |
| Chat | $23.26 | Per analyst-assisted chat contact |
| Web and email | $24.24 | Per analyst-assisted contact |
| All contacts, including self-help | $17.07 | Self-help lowers the blended figure |
| Desktop support cost per ticket | $114.96 | Median $88.07 |
MetricNet 2023 Benchmarking Roundup; sample size not stated in the deck. HDI’s 2021 voice average ($17.19) and MetricNet’s 2023 voice figure ($18.35) come from different years.
HDI’s 2021 worldwide cost breakdown shows where the money goes, as a share of total service desk cost.
| Cost component | Share of cost, 2021 |
|---|---|
| Agent salaries and benefits | 53.6% |
| Indirect personnel | 19.2% |
| Technology | 11.6% |
| Facilities | 11.4% |
| Travel, training, and supplies | 4.2% |
HDI SupportWorld, 2021 (Figure 1, worldwide); benchmark database. Personnel costs together are 72.8% (our calculation: 53.6% plus 19.2%).
The same HDI article puts the cost of replacing one North American agent at about $12,000, and says agents make up about 78% of service desk headcount worldwide. Because personnel is 72.8% of cost, turnover moves cost per ticket as well as headcount.
Ticket Resolution Time and First Response Time Statistics
Freshservice’s 2025 report gives the clearest current resolution and response times, with one caveat that changes every reading: its hours are business hours, except first assign time, which is in calendar hours. A ticket resolved in 21.96 business hours can take several calendar days.
| Measure, Freshservice 2025 | IT tickets | Business-team tickets |
|---|---|---|
| Resolution time (business hours) | 21.96 | 29.08 |
| First response time (business hours) | 9.36 | 13.30 |
| First assign time (calendar hours) | 15.80 | 28.93 |

Vendor platform data. Business teams are non-IT teams using the same platform.
| Freshservice IT tickets | 2021 | 2022 | 2023 | 2024 | 2025 |
|---|---|---|---|---|---|
| Resolution time (business hours) | 29.57 | 22.56 | 25.60 | 24.15 | 21.96 |
| First response time (business hours) | 11.94 | 10.15 | 10.73 | 10.82 | 9.36 |
Freshservice Benchmark Report 2025, five-year trend; vendor platform data. Resolution time is 7.61 hours shorter than in 2021 (our calculation).
Resolution time did not fall in a straight line. It dropped from 29.57 to 22.56 hours in a year, rose to 25.60, then eased to 24.15 and 21.96, so a single year’s change is weak evidence of a trend. First response time ran from 11.94 hours in 2021 to 9.36 hours in 2025, with rises in 2023 and 2024.
| Measure, MetricNet 2023 | Figure |
|---|---|
| Inbound voice handle time | 10.78 minutes |
| Chat handle time | 13.42 minutes |
| Email handle time | 13.70 minutes |
| Average speed of answer | 89 seconds |
| Abandonment rate | 5.8% |
| Desktop support mean time to resolve | 16.9 business hours |
Benchmark database; sample size not stated in the deck.
Handle time and resolution time run on different clocks. MetricNet’s 10.78 minutes is analyst time on one voice contact, while Freshservice’s 21.96 hours is elapsed business time to resolution, so one cannot stand in for the other in a target.
Ticket Volume, Agent Workload, and SLA Statistics
MetricNet’s 2023 deck is the only source here that publishes workload per analyst, utilization, and channel mix, though the deck does not state the peer group size.
| Measure, MetricNet 2023 | Figure | Context |
|---|---|---|
| Inbound voice contacts per analyst per month | 456 | Median 391 |
| Chat sessions per chat analyst per month | 357 | Median 292 |
| Voice utilization | 45.3% | 43.8% in 2010 |
| Occupancy | 80.0% | A separate measure from utilization |
| Chat-to-voice failover | 37.6% | Chat sessions that moved to voice |
| Desktop support tickets per technician per month | 74 | Desktop support, a separate tier from the service desk |
Benchmark database. Utilization and occupancy are reported as separate measures, so check which one a tool reports before comparing.
| Service desk channel mix, MetricNet 2023 | Share of contacts |
|---|---|
| Voice | 43.0% |
| Web and email | 28.3% |
| Chat | 16.2% |
| Self-help | 10.9% |
| Walk-up | 1.4% |
Benchmark database; the five shares add to 99.8% in the source as printed (our calculation).
Voice still carries 43.0% of service desk contacts in MetricNet’s 2023 data, more than chat and self-help combined (27.1%, our calculation). Self-help handles 10.9% of contacts, at $2.37 a ticket in HDI’s 2021 channel data.
Freshservice reports its SLA rates separately for IT and business teams. The report’s figures do not show how demanding each customer’s targets were, so a high rate shows that tickets met their targets and says nothing about how tight those targets were.
| SLA measure, Freshservice 2025 | IT tickets | Business-team tickets |
|---|---|---|
| Resolution SLA | 96.16% | 95.22% |
| First response SLA | 95.99% | 94.24% |
Vendor platform data. The 96.16% is the resolution SLA only.
Help Desk Customer Satisfaction Statistics
Help desk customer satisfaction is the metric where sources disagree most. Freshservice describes CSAT as usually calculated from a short survey that users complete after their ticket is resolved, and reports 97.83% cumulatively across IT and non-IT tickets. MetricNet reports satisfaction by channel for voice, chat, and desktop support; its 2023 deck does not describe how participating desks collect the scores.
| Measure | Figure | Source, year | Data type |
|---|---|---|---|
| Voice customer satisfaction | 81.1% (81.0% in 2010) | MetricNet, 2023 | Benchmark database |
| Chat customer satisfaction | 77.5% | MetricNet, 2023 | Benchmark database |
| Desktop support customer satisfaction | 81.3% | MetricNet, 2023 | Benchmark database |
| Customer satisfaction, IT and business-team tickets combined | 97.83% | Freshservice, 2025 | Vendor platform data |
Freshservice’s 97.83% is calculated cumulatively across IT and non-IT tickets.

The 16.7-point gap between 81.1% and 97.83% (our calculation) is a gap between datasets, not proof that one group of help desks serves users better. Freshservice’s figure covers its own customers’ post-ticket surveys; MetricNet’s deck states neither its sample nor its survey method, so neither number is the other’s equivalent. Within MetricNet’s own data, voice satisfaction moved from 81.0% in 2010 to 81.1% in 2023.
Help Desk Workforce Statistics: Employment, Pay, and Turnover
The US Bureau of Labor Statistics projects computer support specialist employment to decline 3% from 2025 to 2035, a loss of 24,300 jobs. The category covers help desk work among other support roles, so it describes the wider occupation rather than counting help desk agents.
| Measure | Figure | Source, year | Data type |
|---|---|---|---|
| Computer support specialist jobs | 903,100 | BLS, 2025 | Government statistics |
| Median annual pay | $62,890 | BLS, May 2025 | Government statistics |
| Projected employment change, 2025 to 2035 | -3% (24,300 fewer jobs) | BLS projections | Government statistics |
| Projected annual openings | About 48,700 | BLS projections | Government statistics |
| Service desk annual analyst turnover (total) | 43.1% (median 38.3%) | MetricNet, 2023 | Benchmark database |
| Service desk analyst tenure | 28.8 months | MetricNet, 2023 | Benchmark database |
| Desktop support technician turnover (total) | 36.1% | MetricNet, 2023 | Benchmark database |
| Desktop support technician tenure | 27 months | MetricNet, 2023 | Benchmark database |
| Service desk absenteeism | 7.8% | MetricNet, 2023 | Benchmark database |
| New-hire training | 92 hours | MetricNet, 2023 | Benchmark database |
| Analyst job satisfaction | 75.7% | MetricNet, 2023 | Benchmark database |
| Annual agent turnover (total, earlier point) | 40.6% average, 35.1% median (range 5.6% to 104.2%) | HDI SupportWorld, 2018 (article) | Benchmark database |
| Average agent tenure (earlier point) | About 2.5 years | HDI SupportWorld, 2018 | Benchmark database |
Every turnover figure here is total turnover: all agents who leave, divided by average headcount (HDI’s definition). The 2018 chart covers about 80 service desks (our count from the chart’s histogram).
The BLS projection is a decline, and we report it as one. It sits beside about 48,700 projected openings a year, which BLS attributes to the occupation as a whole; we did not find BLS separating help desk work from the rest of the category.
MetricNet’s 43.1% turnover is higher than HDI’s 40.6% from 2018, and both count every leaver, whatever the reason. Compare a desk’s own turnover only against another total figure; our call center turnover statistics cover voluntary and total attrition in contact centers. At about $12,000 per departing North American agent (HDI, 2021), turnover is a cost line as well as a staffing one.
AI-Assisted Help Desk Statistics
Freshservice’s 2025 report is the only source in this set with measured AI effects, and two limits apply to them. It reports that tickets handled with its Freddy AI Copilot, a tool that assists the agent, showed a 76.6% drop in resolution time and a 41.1% cut in first response time. The comparison group is tickets handled without AI, so easier tickets may have been the ones routed to the tool (our reading).
The report also gives a 65.7% deflection rate for Freddy AI Agent, a virtual agent. That figure covers only conversations that went through Freddy AI Agent, not all tickets, so it is not an overall deflection rate. All three figures are vendor-measured, and none describes a desk without human agents.
14 Help Desk Statistics That Fail a Source Check
Fourteen figures recur across help desk pages with no source, a wrong label, or a date that makes them stale. Each row records where the trail ends in October 2026. A failed figure may still be true. For each one, we either found no one who shows how it was measured, or found that it measures something other than what the repeating pages say.
| Figure as printed | What it is, or where the trail ends | Verdict |
|---|---|---|
| F1. “$22 per ticket” | HDI’s 2017 North American, fully loaded cost of a Level 1 ticket, repeated with no level, year, or region | Traces, but stale and stripped of its level |
| F2. “$15.56 average cost per ticket” | Attributed to MetricNet in blog posts. The MetricNet cost-per-ticket page we read does not contain it | Not on the cited source; dropped |
| F3. “68.8% net first-level resolution” | MetricNet’s 2023 desktop support incident first contact resolution. MetricNet’s service desk net first-level resolution is 78.9% | Mislabeled |
| F4. “74.3% first-level resolution for automated tickets” | HDI’s 2017 global average first-level resolution across service desks. It has no link to automation | Mislabeled |
| F5. “22% of tickets are resolved for free with automation” | No source found. It may be a garbled version of a claim about automation shortening resolution times; unverified | Untraceable |
| F6. “Ticket volume is up 16% since the pandemic” | Traces to Zendesk’s COVID-19 Benchmark Snapshot of March 2020, which covered a few weeks at the start of the pandemic. Coverage from that month ties the 16% to different regions and baselines, and Zendesk’s live page, updated in 2021, no longer prints it. It describes a short window, not a trend | Misdescribed |
| F7. “Help desk software use rose from 11% in 2020 to 53% in 2024” | Repeated on vendor pages only, none with a source. A second exact-string check found no study | Untraceable |
| F8. “The help desk software market will reach $21.8 billion by 2027” | A forecast for the helpdesk automation market (from US$3.4 billion in 2020 to US$21.8 billion by 2027), announced by ResearchAndMarkets through Business Wire in December 2020. It does not cover help desk software overall | Relabeled forecast |
| F9. “20% to 50% of help desk calls are password resets (Gartner), at $70 a reset (Forrester)” | Every page found says Gartner “has consistently reported” it, and none names a document. We found no Gartner or Forrester document carrying either figure | Vendor-quoted only |
| F10. “95% (or 98%) of service desk issues are resolved over calls” | Two pages print two numbers for one claim; no source found for either | Untraceable |
| F11. “670 working hours saved every year” | Appears on a single page with no method or source | Untraceable |
| F12. “AI cuts response time from 7 seconds to 3 seconds” | The same claim elsewhere reads “more than seven hours to three seconds,” relayed second-hand from a vendor. We did not open the original, so neither form is verified | Garbled units |
| F13. “Chatbots saved around $8 billion” | A Juniper Research forecast from May 2017 of more than $8 billion a year in chatbot cost savings by 2022, printed as a result. We read it in press coverage from May 2017, not in Juniper’s own release | Forecast printed as fact |
| F14. “Help desk benchmarks: 6-minute handle time, 70% to 79% first contact resolution, 64% to 80% satisfaction, 0% to 7.6% backlog” | No source on the page. The 6-minute handle time sits close to the 6 minutes 3 seconds that Call Centre Helper averaged from figures planners typed into its staffing calculator, as traced in our call center benchmarks; the ranges have no method | Unsourced |
Checked October 2026. Where we read an origin through press coverage instead of the publisher’s own document, the row says so.
What to cite instead: for cost, the HDI 2017 ladder with its year, or MetricNet’s 2023 cost per contact. For first-level resolution, MetricNet’s 78.9% with the word “net.” For market size or software adoption, no figure here earns a citation. If a page cites a figure from this list, ask for the study and the method; if neither exists, leave the number out.
Using These Benchmarks to Set Help Desk Targets
Before a benchmark goes into a business case, check four things: its definition, its data type, its year, and its unit (business hours or calendar hours, total or voluntary turnover, net or gross resolution). A target built on MetricNet’s 78.9% net first-level resolution will mislead a team that measures gross, and a target built on Freshservice’s business-hour resolution time will mislead a team that runs a calendar clock.
Digital Minds BPO has built dedicated teams since 2010, with a 94% client retention rate and an average client partnership of 4.7 years. If you are weighing an outsourced team against the benchmarks above, our outsourced help desk service and outsourced technical support pages describe how those teams are run, and our guide to how outsourced IT support is scoped covers where each tier of work sits.
Frequently Asked Questions About Help Desk Statistics and Metrics
Is help desk a good career?
The data gives a mixed answer. BLS reports a median annual wage of $62,890 (May 2025) for computer support specialists and projects a 3% decline in employment from 2025 to 2035, with about 48,700 openings a year. MetricNet’s 2023 data shows 43.1% total analyst turnover and 75.7% analyst job satisfaction. The BLS category is wider than help desk work, so treat it as a guide.
Will AI replace the help desk?
No source in this post measures replacement. The measured evidence is Freshservice’s 2025 vendor data on AI assisting agents (a 76.6% drop in resolution time on tickets handled with its Copilot, against tickets handled without AI) and BLS’s projected 3% decline in the occupation. The first describes assistance, the second describes headcount, and neither links the two.
What is the difference between help desk metrics and KPIs?
A help desk metric is any measurement, such as handle time or first response time. A help desk KPI is a metric you have tied to a target and an owner. First contact resolution is a metric until a desk commits to a number, and then it is a KPI.
What is a good first contact resolution rate for a help desk?
MetricNet’s 2023 data gives a net first contact resolution of 70.2% (median 68.4%), and Freshservice’s 2025 platform data gives 74.14% on IT tickets. Check the definition first: MetricNet’s net first-level resolution is 78.9%, and a gross rate would read lower.
What is the average cost per ticket for a help desk?
MetricNet’s 2023 service desk cost per analyst-assisted contact is $20.61 (median $16.50), and HDI’s 2021 North American averages for assisted channels run from $15.07 for web submit to $37.52 for walk-up. Desktop support is higher, at $114.96 per ticket (MetricNet, 2023). Each figure is total operating expense divided by volume.
What percentage of help desk tickets are password resets?
We found no reliable figure. The commonly printed 20% to 50% is credited to Gartner on vendor pages, but none of them names a Gartner document, so it is vendor-quoted only (F9 above). Use your own ticket categories instead.

Sofia Reyes is a Content Writer and SEO Specialist at Digital Minds BPO, where she focuses on outsourcing-industry research and educational content for business decision-makers. Based in the Philippines, she has 7 years of experience writing B2B content across SEO, content strategy, and Generative Engine Optimization (GEO). Sofia partners with Digital Minds BPO’s operations and account management teams to translate 15+ years of frontline BPO experience into clear, sourced guides on call center, customer service, and back-office outsourcing. Her work supports prospects evaluating outsourcing decisions across the company’s three dedicated facilities, where the team delivers a 94% client retention rate for clients ranging from Fortune 500 enterprises to growth-stage businesses.