This post sets out 24 sourced call center benchmarks for 2026 and audits six widely quoted figures that we could not trace to a study. Each benchmark carries its source, the year of the data, and the sample size where the publisher disclosed one.
SQM Group (2024 data, 500+ centers) grades a first call resolution rate of 70% to 79% as good and 80% or more as world-class. ContactBabel’s 2026 US Contact Center Decision-Makers’ Guide (207 US organizations) puts average speed to answer at 74 seconds and the cost of an inbound call at $7.20. The American Customer Satisfaction Index for Q4 2025 scored the US economy at 76.9 out of 100.
The rest of the familiar list, often presented as call center industry standards, traces to no study we could find: the 80/20 service level, a 28-second answer time, a six-minute handle time. This audit was compiled by Digital Minds BPO, a business process outsourcing company in Naga City, Philippines, that has run call center operations since 2010. For market size and industry context rather than target values, see our call center statistics roundup.
How These Call Center Benchmarks Were Sourced
Three questions decided how each figure was graded: who measured it, when, and across how many organizations or customers. A figure with no answer to the first question went to the audit section instead.
The benchmarks fall into three grades, and the post uses them throughout.
- Grade A, measured. An identifiable survey with a disclosed sample. SQM Group’s FCR benchmark (500+ centers, a minimum of 400 surveys per center), ContactBabel’s 2026 guide (207 US organizations plus 1,000+ US consumer interviews), and the ACSI (about 200,000 customers) sit here.
- Grade B, attributed. A claim a publisher makes about its own research, with no linked study. SQM’s savings estimates for FCR are Grade B, and they are labelled “SQM’s research” each time they appear.
- Grade C, convention. A number repeated from page to page with no study behind it. Every entry in the audit section is Grade C.
| Dataset | Publisher | Data year | Sample |
|---|---|---|---|
| Call center FCR benchmark | SQM Group | 2024 (published 6 Feb 2025) | 500+ centers, minimum 400 surveys per center |
| US Contact Center Decision-Makers’ Guide | ContactBabel | 2026 edition | 207 US organizations plus 1,000+ US consumer interviews |
| National ACSI | ACSI | Q4 2025 | About 200,000 customers |
The three core datasets. Two workforce datasets and the ACSI telecom study are described where they appear.
Two limits apply. Inbound-voice benchmarks do not transfer to chat or email, so figures are labelled by channel wherever the source allows. And the ACSI has no call center category; its scores are by sector, and this post reads them as sector context, not as call center scores.
Nothing here describes the operation of Digital Minds BPO. We publish no FCR, answer-speed, handle-time, or satisfaction figure of our own, and none of the numbers below should be read as one.
First Call Resolution Benchmarks
First call resolution (FCR) is the share of contacts resolved without the customer having to contact the center again. It is the most thoroughly measured metric in this post, and one publisher dominates the evidence.
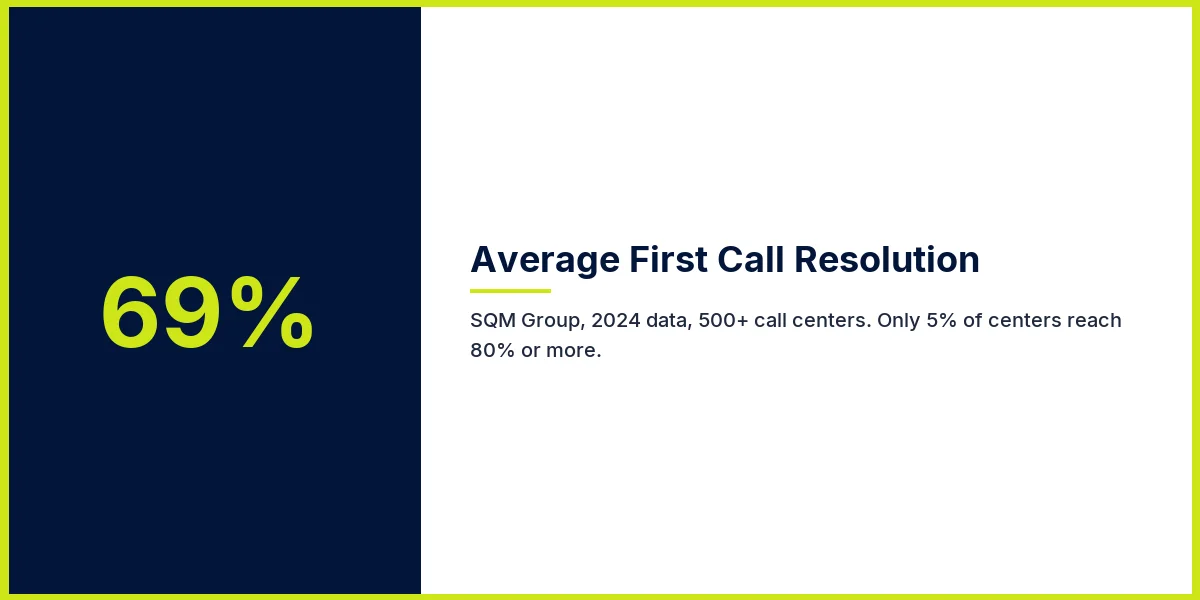
SQM Group’s 2024 FCR benchmark, published on 6 February 2025, puts the all-industry average at 69%. SQM grades 70% to 79% as good and 80% or above as world-class, and only 5% of centers reach that top band. SQM reports a range of 43% to 88%. The average sits one point below the bottom of SQM’s own “good” band, so the typical center is not yet good by the publisher’s own grading.
The more useful cut is by call type, because one blended target hides a 25-point spread.
| Call type | FCR (SQM Group, 2024 data) |
|---|---|
| General inquiries | 73% |
| Account maintenance | 72% |
| Orders | 71% |
| Billing | 69% |
| Claims | 61% |
| Technical support | 60% |
| Complaints | 48% |
SQM Group call center FCR benchmark, 2024 data, 500+ centers, minimum 400 surveys per center.
Complaints resolve on the first contact 48% of the time, 21 points below the all-industry average. A center whose queue is mostly complaints and technical support, and which holds itself to 69%, is measuring itself against a mix it does not handle.

SQM’s research goes further. It states that every 1% improvement in FCR is worth $286,000 in annual savings and 1.4 points of interactional NPS, and that 95% of customers continue doing business when FCR is achieved. These are Grade B figures. SQM’s page attributes them to its own research without linking a study, so they are SQM’s estimate, and we could not find independent confirmation of them.
Speed of Answer and Service Level Benchmarks
ContactBabel’s 2026 guide (207 US organizations plus 1,000+ US consumer interviews) measures average speed to answer at 74 seconds, which the publisher describes as one-third higher than the pre-pandemic average. It is the only current primary-survey figure for answer speed that we could verify.
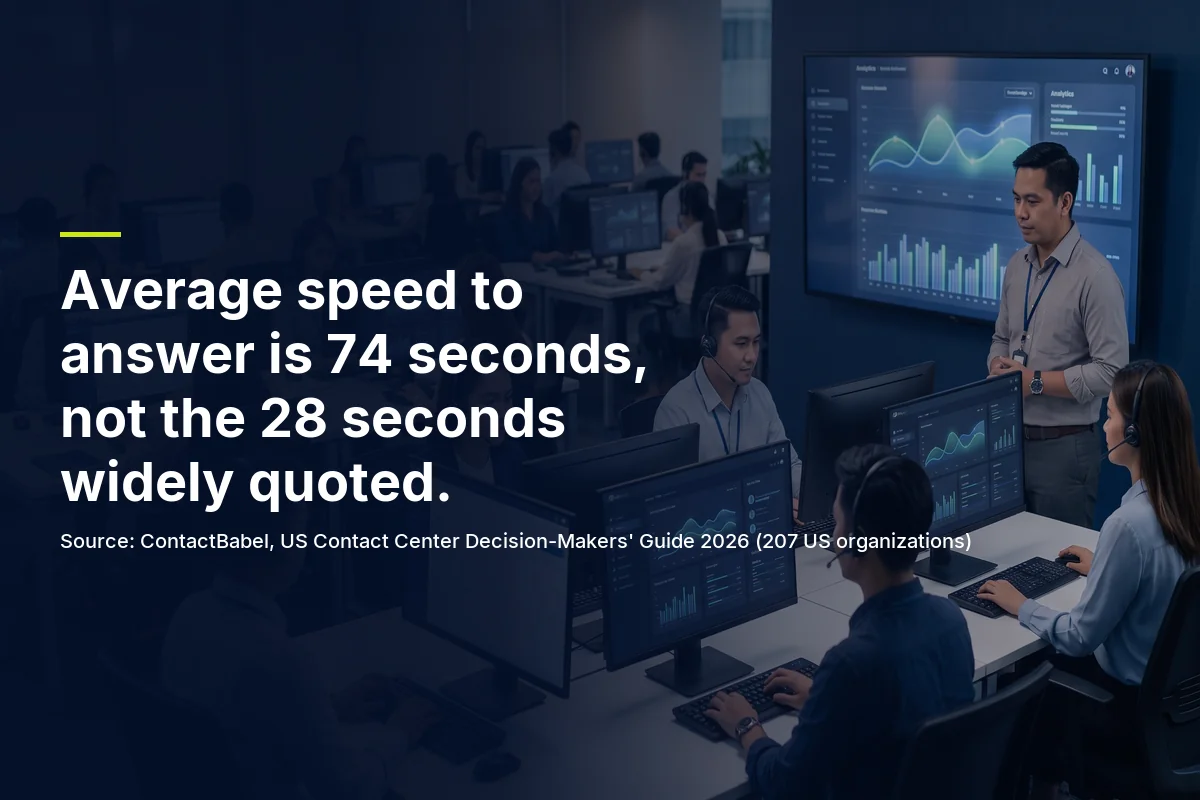
The figure widely quoted instead, 28 seconds, traces to no study we could find (see the audit section). The measured average is more than two and a half times the folklore number.
Average speed to answer and service level measure different things. ASA is a mean across all calls. Service level is the percentage of calls answered inside a fixed threshold, such as the familiar 80% in 20 seconds. A center can post a respectable average while a long tail of callers waits far longer, and a mean of 74 seconds says nothing about how many callers were answered within ten seconds.
The ContactBabel material we could verify carries no industry service-level attainment figure, and we found no primary study that sets 80/20 as a standard. Treat it as a common starting convention, and set the threshold from the wait your own callers will tolerate.
One caution on the 74 seconds: it is a US survey average across 207 organizations, so individual centers will sit well above and well below it. It answers the question “are we in the normal range?” It is not a target.
Cost per Call and Cost per Contact Benchmarks
ContactBabel’s 2026 guide puts the average cost of an inbound call at $7.20. Per the same survey, an inbound call costs 47% more than an email and 23% more than a web chat.
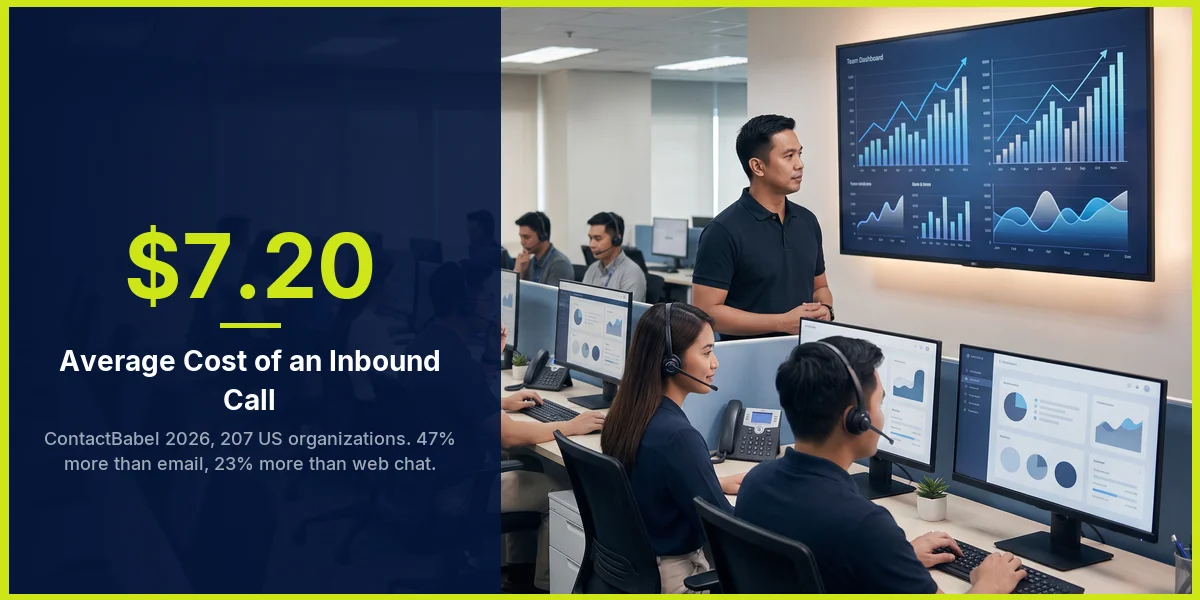
| Channel | Cost per contact (ContactBabel, 2026 edition) |
|---|---|
| Inbound call | $7.20 |
| An inbound call costs 47% more | |
| Web chat | An inbound call costs 23% more |
ContactBabel, 207 US organizations plus 1,000+ US consumer interviews.
Two flags. ContactBabel gives the voice figure in dollars and the other two as relative gaps, and no dollar figure for email or chat was verifiable, so none is stated here. And $7.20 is a US average across 207 organizations. The public summary does not break it into labor, technology, and overhead, so it is a reference point for comparison, not a price any provider quotes.
Anyone benchmarking cost per contact should calculate their own fully loaded figure the same way for every channel before setting it against $7.20.
Customer Satisfaction Benchmarks by Industry
The ACSI has no call center category. It scores companies by sector, so the figures below describe customer satisfaction with sectors that run large contact operations. They are not CSAT benchmarks for call centers.
The ACSI’s national score for Q4 2025 was 76.9 out of 100, from a sample of about 200,000 customers. It fell 0.5% year on year, and the ACSI reports that it has not materially increased since 2017. The ACSI Telecommunications, Cell Phone, and Smartwatch Study 2026 (interviews April 2025 to March 2026) adds the sector view.
| Measure | ACSI score | Change |
|---|---|---|
| National (Q4 2025) | 76.9 | Down 0.5% year on year |
| Wireless phone service (2026 study) | 77 | Up 3%, a record high |
| Internet service providers (2026 study) | 73 | Up 1% |
| ISPs: fiber | 76 | Within the ISP total |
| ISPs: non-fiber | 71 | Within the ISP total |
ACSI national release (Q4 2025, about 200,000 customers) and Telecommunications, Cell Phone, and Smartwatch Study 2026 (interviews April 2025 to March 2026).
Wireless reached a record 77, yet the national score has not materially increased since 2017. Satisfaction rose in one sector while the economy-wide reading slipped, which is a reason to set customer service benchmarks against a service’s own sector and not against a single national figure.
The ACSI also publishes scores for banking, insurance, retail, health care, and other sectors, but we opened only the two releases above, so no others appear here. No NPS-by-industry table appears either: we could not verify a current primary cross-industry NPS source, and as of September 2026 the NICE Satmetrix benchmark page behind the figures that secondary blogs still repeat redirects to a NICE product page. For survey data on what customers expect from service, see our customer service statistics.
Handle Time, Abandonment, and Occupancy Benchmarks
These three metrics carry widely repeated numbers and the thinnest evidence in this post. For none of them could we verify a primary study that sets a target value.
| Metric | What it measures | Verified primary benchmark |
|---|---|---|
| Average handle time | Talk time, hold time, and after-call work per contact | None found |
| Abandonment rate | Share of callers who hang up before an agent answers | None found |
| Occupancy | Share of logged-in time an agent spends handling contacts | None found |
The commonly quoted figures for these three are examined in the audit section below.
Two of the common figures do have a traceable origin. Call Centre Helper reports an average handle time of 6 minutes and 3 seconds and an average occupancy of 83.3%, both taken from 190,702 entries typed into its Erlang staffing calculator. Those are the values planners entered when sizing a team, so they describe planning assumptions, not measured calls.
What the evidence does support is why a single figure travels badly. SQM’s FCR spread, 73% for general inquiries against 48% for complaints, shows how far call types diverge, and a queue that mixes billing questions with technical faults will not share one handle time. That is an inference from SQM’s resolution data, not a published handle-time finding.
The three also pull against each other. Raising occupancy trims idle time and leaves less spare capacity when calls bunch up, so waits lengthen and more callers hang up. That is queueing arithmetic, and it is the reason a target for one of the three should not be set without the other two in view.
Benchmarks by Channel: Voice, Chat, and Email
The FCR and answer-speed figures in this post describe inbound voice, so they should not stand in as contact center benchmarks for chat or email. The channel evidence we could verify comes from ContactBabel’s 2026 guide, and it covers cost and automation.
On cost, an inbound call costs $7.20, which is 47% more than email and 23% more than web chat (ContactBabel, 2026 edition). On automation, ContactBabel reports that 18% of web chats are handled without human agents, up from 6% in 2020.
That share has tripled since 2020. The other side of the number is the larger one: 82% of web chats still reach a human agent.
No verified primary benchmark for chat first response time or email response time was available for this post, so none is stated. Chat-specific data, including the industry benchmarks that do carry a named source, sits in our live chat statistics.
Agent Workforce Benchmarks
SQM Group (2025) reports an average call center agent attrition rate of 38%. That is a total-attrition figure, and we could not confirm its sample size.
For the Philippines, the Contact Center Association of the Philippines (CCAP) and Willis Towers Watson surveyed 145 organizations, and Newsbytes reported the results on 28 May 2024. Philippine BPO voluntary attrition was 36% in 2021 and 31% in 2022. The association rebranded in May 2026 as the Customer Xperience Association of the Philippines (CXAP), the name to search for newer releases.
| Source | Figure | What it measures | Year |
|---|---|---|---|
| SQM Group | 38% | Average agent attrition, total | 2025 |
| CCAP / Willis Towers Watson (145 organizations) | 36% | Philippine BPO voluntary attrition, annual | 2021 |
| CCAP / Willis Towers Watson (145 organizations) | 31% | Philippine BPO voluntary attrition, annual | 2022 |

The 38% is total attrition and the CCAP rows are voluntary only. The two are not comparable.
Setting a voluntary figure against a total figure produces a gap that means nothing. The full picture, including monthly versus annual rates and the source audit, is in our call center turnover statistics. For how Philippine teams are built and run, see our page on Philippine call center operations.
Call Center Benchmarks That Do Not Survive a Source Check
Six benchmarks recur across the ranking pages we were able to open for this search, and none could be traced to a study. Each is a Grade C convention: repeated widely, accurate for some centers, and sourced to nobody. The table records where each trail ends, not whether the figure makes a bad target.
| Figure in circulation | What we could trace | Grade |
|---|---|---|
| 80/20 service level (80% of calls answered in 20 seconds) | Origin unknown. Two folk accounts exist: 1970s automatic call distributor defaults, or an AT&T study that we could not locate | C |
| Average speed to answer of 28 seconds | No study named. ContactBabel’s 2026 survey measured 74 seconds | C |
| Average handle time of about six minutes | Traces to Call Centre Helper: 6 minutes 3 seconds, averaged from 190,702 entries typed into its Erlang staffing calculator. Planner inputs, not measured calls | C |
| Abandonment rate of 5% to 8% | Vendor convention, also stated as 2% to 5% and up to 9%. No methodology or sample | C |
| Occupancy of 85% | Secondary blogs credit industry research with no link, year or sample. The nearest traceable figure is Call Centre Helper’s 83.3%, averaged from the same calculator entries | C |
| CSAT of 75% to 84% as a cross-industry norm | Each source states a different range, and none names a study | C |
Six widely repeated call center benchmarks and where the trail ends. Checked September 2026 against the primary sources named in this post.
The headline finding is the second row. A 28-second average answer time is repeated without a named study, while the one current primary survey we could verify measured 74 seconds across 207 US organizations. The folklore number is less than 40% of the measured one. Anyone who has set an answer-speed target around 28 seconds has been aiming at a figure we could not trace to any survey.
The 80/20 rule deserves its own note because it is the only one of the six with origin stories attached. Both, hardware defaults from the 1970s and an AT&T study we could not locate, are folk accounts, and neither has a citable document. That makes 80/20 a long-lived convention rather than a finding.
The CSAT range needs the most care, because one real measurement happens to fall inside it. The ACSI’s national score of 76.9 out of 100 sits within 75% to 84%, which can make the range look validated. It is not. The ACSI is a 0 to 100 index of satisfaction with companies by sector, not a percentage of satisfied callers, and no source we found ties the 75% to 84% band to a study of call center satisfaction. One real reading landing inside a convention does not turn the convention into a benchmark.
Key Takeaways
- FCR has the strongest evidence. SQM Group (2024 data) puts the average at 69%, good at 70% to 79%, and world-class at 80% or more, reached by 5% of centers.
- ContactBabel’s 2026 survey measured average speed to answer at 74 seconds. The 28-second figure in wide circulation traces to no study we could find.
- An inbound call costs $7.20 on average in the US, 47% more than email and 23% more than web chat (ContactBabel, 2026 edition).
- The ACSI scored US customer satisfaction at 76.9 out of 100 in Q4 2025, with no material increase since 2017. It has no call center category, so read it by sector.
- Handle time, abandonment, and occupancy have no primary benchmark we could verify. The 80/20 service level is a Grade C convention with an unknown origin.
- Compare attrition like with like. SQM’s 38% (2025) is total; CCAP’s 36% (2021) and 31% (2022) are voluntary.
Operator note. A benchmark gives an SLA its starting point, and the right target depends on call type. SQM’s own data (2024) runs from 73% FCR on general inquiries to 48% on complaints, so one blended target for a mixed queue is too easy for one call type and out of reach for another. Split the queue by call type first. Set a target for each, then review it against your own data after the first full quarter.
Conclusion
A benchmark answers one question: are we in the normal range? A target for your own queue comes from splitting calls by type, measuring for a full quarter, and setting service levels against what your callers will tolerate.
Digital Minds BPO has built dedicated call center teams since 2010, from three office-based facilities in Naga City, with a 94% client retention rate and an average partnership of 4.7 years. If you are setting SLAs for an outsourced team, our call center outsourcing services page explains how those teams are run.
Next Step
Setting SLA targets for a mixed call queue?
Tell us your call types, channels, and volumes. We will start from the sourced benchmarks and tell you honestly whether we are the right fit for the work.
✓ No setup fees · ✓ No recruitment fees · ✓ Team Leader and Project Manager included
Frequently Asked Questions About Call Center Benchmarks
What is the 80/20 rule in call centers?
The 80/20 rule is a service-level target: 80% of calls answered within 20 seconds. It is a convention, not a measured benchmark, and its origin is unknown. Two folk accounts trace it to 1970s automatic call distributor defaults or to an AT&T study that we could not locate. Set the threshold from what your own callers will tolerate, and treat 80/20 as a starting point.
What is a good first call resolution rate?
SQM Group’s 2024 data (500+ centers, minimum 400 surveys per center) puts the average at 69% and grades 70% to 79% as good and 80% or more as world-class. Only 5% of centers reach the top band. The right target depends on call type, from 73% for general inquiries down to 48% for complaints.
What is the average cost of a call center call?
ContactBabel’s 2026 US Contact Center Decision-Makers’ Guide puts the average inbound call at $7.20, which is 47% more than an email and 23% more than a web chat. The figure is a US average across 207 organizations, so use it as a reference point and calculate your own fully loaded cost before comparing.
What is an acceptable call abandonment rate?
No primary study that we could verify sets an acceptable abandonment rate. The range most often quoted, 5% to 8%, appears without a methodology or sample. Set the target from your own queue, and read it alongside speed of answer and occupancy, since the three move together.
What are the KPI benchmarks for call centers by industry?
Verified benchmarks split by call type and by sector, not by a single industry table. SQM Group’s 2024 FCR data runs from 73% for general inquiries to 48% for complaints. The ACSI (2026 telecom study) scores wireless phone service at 77 and internet service providers at 73. No current primary cross-industry NPS source could be verified, so none is given.

Sofia Reyes is a Content Writer and SEO Specialist at Digital Minds BPO, where she focuses on outsourcing-industry research and educational content for business decision-makers. Based in the Philippines, she has 7 years of experience writing B2B content across SEO, content strategy, and Generative Engine Optimization (GEO). Sofia partners with Digital Minds BPO’s operations and account management teams to translate 15+ years of frontline BPO experience into clear, sourced guides on call center, customer service, and back-office outsourcing. Her work supports prospects evaluating outsourcing decisions across the company’s three dedicated facilities, where the team delivers a 94% client retention rate for clients ranging from Fortune 500 enterprises to growth-stage businesses.