This post presents 40+ call center turnover statistics for 2026, each one carrying its named source, the year the data was collected, and the sample size where the publisher disclosed one. It also identifies nine widely quoted turnover figures that do not survive a source check.
That second half is the reason this post exists. The statistics circulating on call center attrition are unusually poorly sourced, even by the standards of industry content. Figures get republished without a year. Country tables from 2007 appear on pages presented as current benchmarks. Cost-per-replacement numbers trace back through three vendor blogs and then stop, with no study at the bottom.
Every figure below states what it measures, who measured it, and when. Where a number could not be traced to a primary source, it appears in the audit section near the end rather than in the body, and the reason is stated. Digital Minds BPO has run call center operations in the Philippines since 2010, which is the vantage point this audit was compiled from. For performance and customer satisfaction data rather than workforce data, see our call center performance statistics. For sourced service level, speed to answer and first call resolution figures, see our call center benchmarks.
How Call Center Turnover Is Measured
Three choices sit behind every turnover number: what counts as a departure, over what period, and across which staff. Change any one of them and the same operation reports a different rate. Most published statistics do not say which choices were made.
Voluntary versus involuntary. Voluntary attrition counts people who resigned. Involuntary attrition counts terminations, non-regularizations, and end-of-contract exits initiated by the employer. Total attrition is both. A center with disciplined performance management can run high involuntary attrition and low voluntary attrition, and those two profiles describe very different workplaces.
Monthly versus annual. The formula is separations during the period divided by average headcount during the period, times 100. A 4% monthly rate is not a 4% annual rate. Multiplying by twelve gives an upper bound, because a seat that turns over twice in a year is counted twice while the denominator counts it once.
Government labor data is monthly. Vendor surveys are annual. Comparing them directly is the most common error in this subject.
Agents versus all staff. Agent-only attrition runs higher than all-staff attrition in every dataset that reports both, because team leads, quality analysts, trainers, and support functions turn over more slowly. A company-wide figure and an agent figure from the same operation can differ by 15 points or more.
The Contact Center Association of the Philippines and Willis Towers Watson published all three views of the same industry in the same year, which makes the point better than any explanation can. For 2022, Philippine BPO voluntary attrition was 31%, involuntary attrition was 14.1%, and total attrition was 45%. One industry, one year, three defensible numbers. A citation that quotes any of them without saying which would be technically accurate and practically useless.
Current Call Center Turnover Rates
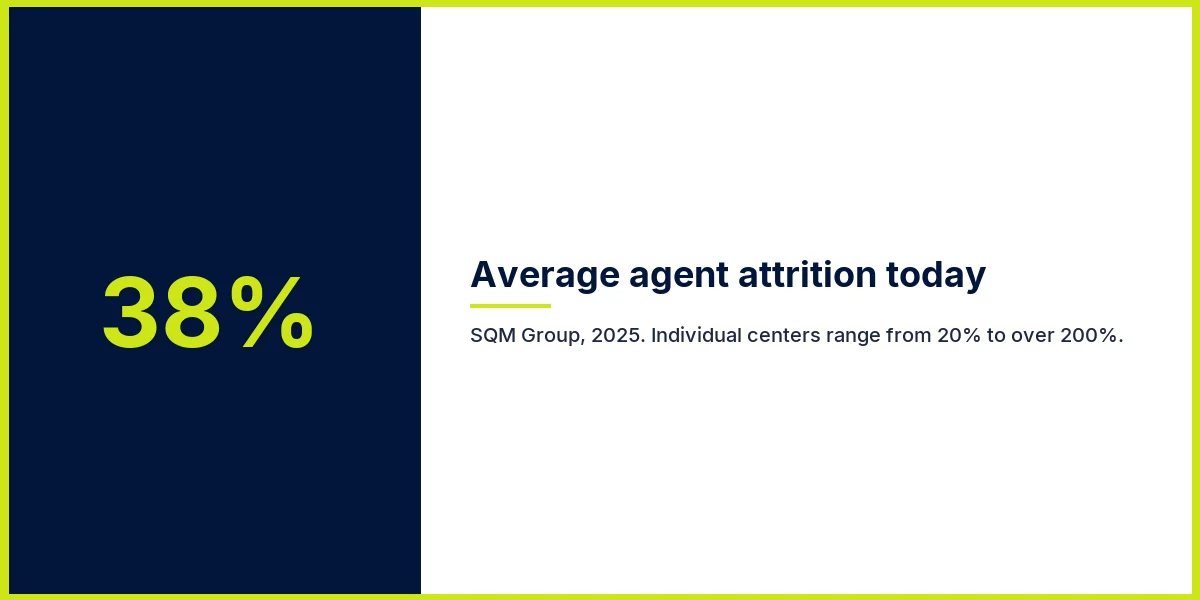
SQM Group (2025) reports an average call center agent attrition rate of 38%, with individual centers ranging from 20% to over 200%. The same research found that 47% of call center managers name turnover and absenteeism as their single biggest operational problem. The 200% figure is not a typographical error; a center that replaces its entire front line twice in a year is a real operating state, usually in high-volume seasonal work.
NICE, in Managing the Modern Contact Center (published April 2025, reporting 2024 data), puts agent attrition at 39% and back-office attrition at 34%. Both fell year over year, from 49% and 47% in 2023. We could not confirm a sample size or fieldwork window for these figures, so this entry is framed conservatively: the direction of travel is documented, the base is not.
ContactBabel, in the 17th edition of its US Contact Center Decision-Makers’ Guide (N=192, fieldwork October 2024 to January 2025), reports the distribution rather than the average, which is more useful. 54% of US contact centers run annual attrition between 21% and over 50%. Roughly 80% of respondents said attrition had risen or held steady.
| Source | Figure | What it measures | Year |
|---|---|---|---|
| SQM Group | 38% | Average agent attrition, total | 2025 |
| NICE | 39% agents / 34% back office | Annual attrition, total | 2024 data, pub. 2025 |
| ContactBabel (N=192) | 54% of centers at 21% to 50%+ | Distribution, annual | Fieldwork Oct 2024 to Jan 2025 |
| CCAP / Willis Towers Watson (145 orgs) | 45% total, 31% voluntary | Philippine BPO, annual | 2022, released May 2024 |
Four independent named sources. The defensible current statement is 38% to 45% depending on measure and geography. The highlighted row is the only one reporting the voluntary and involuntary split separately.

The widest number in circulation belongs in the record with its denominator attached. The Cresta Insights Report (Q1 2022) put attrition at 83.7% since the start of the pandemic. That figure is platform telemetry from roughly 6,000 agents inside Cresta’s own customer base, which skews toward large, high-volume operations that buy conversation intelligence software. It is a real measurement of a real population, and it is not an industry rate.
Turnover Statistics by Region and Country
Only one large-scale, multi-country primary study of call center turnover exists, and it is nineteen years old. That sentence is the most important finding in this section.
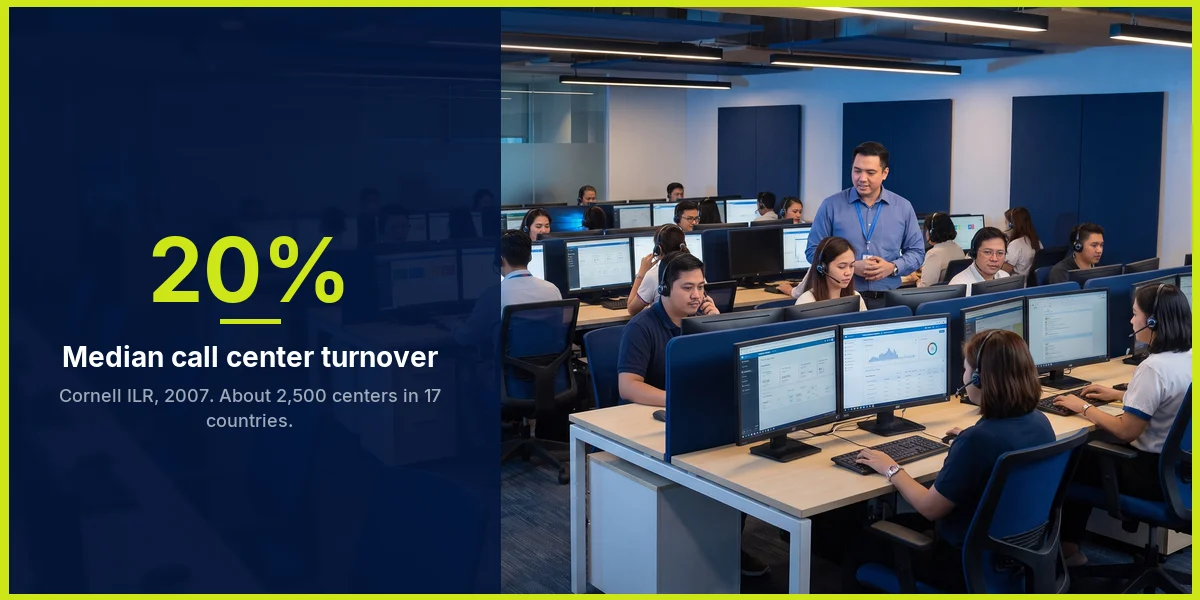
Holman, Batt, and Holtgrewe published The Global Call Center Report through Cornell University’s ILR School in 2007, drawing on fieldwork conducted between 2003 and 2006 across approximately 2,500 call centers in 17 countries, covering 475,000 employees. We could not locate a comparable multi-country study published since.
- Median total annual turnover: 20%, across all 17 countries.
- Country range: 4% (Austria) to 40% (India). A ten-fold spread.
- 15% in coordinated market economies, 25% in liberal market economies, 23% in industrializing economies.
- Roughly one third of the workforce had less than one year of tenure.
Two things follow. A 20% median from properly sampled primary research sits far below the 30% to 45% range the industry treats as normal. And these numbers describe an industry that predates smartphones, social messaging, and widespread remote work, so quoting them as current is indefensible. They appear on several high-authority pages today with the year removed. Cite them as 2007 data or do not cite them.
One caveat belongs here, and it comes from the authors themselves rather than from us. The report states plainly that its rates are “lower than what is often reported anecdotally, and may reflect some conservative estimates in this regard.” The researchers flagged the gap between their measurement and the industry’s folklore in 2007, and nobody has run the study that would settle it since. Read the 20% as the best available measurement carrying its own author’s warning, not as a rebuttal.
The Government Baseline: US Separations and Quits
No vendor survey has the sample size of the US Bureau of Labor Statistics, and no page in this subject seems to use it. The Job Openings and Labor Turnover Survey (JOLTS) reports separations by industry every month, and publishes annual averages of those monthly rates. The figures below are the 2025 annual averages, not seasonally adjusted.
| Monthly rate, 2025 | All industries | Professional and business services |
|---|---|---|
| Total separations | 3.3% | 4.6% |
| Quits | 2.0% | 2.3% |
| Layoffs and discharges | 1.1% | 2.0% |
Each rate above is MONTHLY, not annual. The annual figure is the average of the twelve monthly rates. US Bureau of Labor Statistics, JOLTS, 2025 annual average rates, not seasonally adjusted. Separations from table 20, quits from table 22, layoffs and discharges from table 24.
Two caveats have to travel with these numbers, and they are the reason the comparison is rarely run properly.
JOLTS does not break out call centers. Telephone call centers sit at NAICS 561422, inside administrative and support services, inside professional and business services. The published tables do not go to that depth. Everything above describes the sector containing call centers, not call centers themselves, and anyone who writes it the other way has overstated the data.
The rates are monthly. Annualizing gives roughly 55% total separations and 28% quits for professional and business services. Treat both as upper bounds. They double-count anyone who separates more than once in a year, and in high-churn work that is a meaningful share of the total. Even as an upper bound, the 28% quit figure lands close to the voluntary attrition rates vendors report for contact centers, which is a useful sanity check on numbers that otherwise have nothing to check them against.
Philippine BPO Attrition Statistics
The Contact Center Association of the Philippines (CCAP), working with Willis Towers Watson, surveyed 145 member organizations and released results on 28 May 2024. It is the only regularly published attrition dataset for the Philippine BPO sector, and it reports the voluntary and involuntary split, which most vendor surveys do not. Note for anyone tracing this source today: CCAP rebranded in May 2026 as the Customer Xperience Association of the Philippines (CXAP), so the survey publisher now appears under the newer name.
- Voluntary attrition: 36% in 2021, falling to 31% in 2022.
- Involuntary attrition: 14.1% in 2022. Total attrition for that year: 45%.
- Unauthorized absence: 9.9% in 2022.
- No-show rate, agents who did not report on day one: 1.9% in 2022.
The survey also reported 19% voluntary attrition for the first half of 2023, and that number needs a caveat it almost never travels with. It is a six-month rate, published alongside a six-month total of 28%. It is not an annual figure and doubling it is not how attrition annualizes. No full-year 2023 voluntary figure appears in the released survey coverage, so there is no 2023 annual number to quote here. The last verified full years are 2021 and 2022.
CCAP names two reasons for the decline. The first is the spread of hybrid and work-from-home arrangements; board director Haidee Enriquez is quoted directly to that effect, and the same survey found 78% of agents prefer hybrid work. The second is expansion into provincial cities, moving operations closer to where staff actually live.

Digital Minds BPO can speak to the second lever from direct experience, not the first. Our teams are office-based across three facilities in Naga City, roughly 380 kilometers from Manila, which means the commute is measured in minutes and the talent pool is not competing with a dozen towers in a single business district. That is the countryside expansion CCAP describes, run as the default rather than as an experiment. Digital Minds BPO runs 8 to 10 percent voluntary attrition across all staff, measured annually.
Against CCAP’s voluntary benchmark of 36% in 2021 and 31% in 2022, that is roughly three times better. The comparison holds only because both figures measure the same thing, voluntary departures over a full year. Setting a voluntary figure against somebody else’s total attrition rate would produce a wider gap and a meaningless one, which is the error this post exists to expose. See also our outsourcing industry statistics and our overview of call center operations in the Philippines.
The Cost of Call Center Turnover
Exactly one cost-per-replacement figure survives a source check, and it is nineteen years old. No dollar figure in current circulation could be traced to a primary source at all; the three most quoted are documented in the audit section below and none are used here.
The one that holds up is expressed as a proportion of pay rather than as a dollar amount, which is exactly why it has aged better than the rest. Cornell ILR’s Global Call Center Report (2007) asked managers what it cost them to recruit, screen and train a replacement, then normalised the answers against local pay. Replacing one agent averaged 16% of a call center worker’s gross annual earnings, roughly two months of a typical worker’s pay. Counting lost productivity as well, the report put the true cost at three to four months of pay. A ratio survives currency moves, inflation and nineteen years in a way that “$15,000 per agent” does not.
The operational consequence is better documented than the price. Deloitte Digital’s Global Contact Center Survey (2023) found that 63% of contact centers report staffing gaps.
A single industry cost figure was never going to hold, because the components differ by an order of magnitude between operations. The durable answer is a method rather than a number. Price your own replacement cost across five lines:
- Sourcing and screening hours per filled seat, at your actual offer-acceptance ratio rather than your target one.
- Paid training days before the agent takes a live contact.
- The nesting period between first live contact and full productivity, paid at full rate against a reduced load.
- Supervisor and trainer time redirected from the tenured team.
- Coverage during the vacancy: overtime, borrowed headcount, or accepted service level degradation.
In our experience the largest single line is usually the third one, because it is fully paid time carrying only partial output, and it is the line most often left out of the estimate entirely.
Absenteeism and Tenure Statistics
Absenteeism and tenure are the two numbers that predict turnover before turnover shows up in a report, and both are more thinly sourced than attrition itself.
Per CCAP and Willis Towers Watson (2022 data, 145 organizations), unauthorized absence in Philippine BPO ran at 9.9%, and 1.9% of hired agents never reported for their first day. From the Cornell ILR Global Call Center Report (2007), roughly one third of the global call center workforce had less than one year of tenure at the time of fieldwork. SQM Group (2025) counts absenteeism alongside turnover in the 47% of managers who name it their biggest problem, which reflects how the two behave operationally. They rise together.
The Cornell ILR report (2007) also measured sick leave directly: across all 17 countries the median was 6 sick days per employee per year, rising to 11 in India and 10 in the Netherlands, and falling to 1 in South Korea and Israel. That figure matters for a second reason. A widely republished claim that “6% of agents are absent on a typical day” appears to be that same statistic mis-transcribed, a median of six sick days per year restated as a daily percentage. The two are not the same measurement and they are not the same order of magnitude. A separate figure in circulation, 8.2 absence days per agent per year, appears nowhere in the report and could not be traced at all. Related workforce and experience data sits in our customer service benchmarks.

Widely Quoted Turnover Figures That Do Not Survive a Source Check
Digital Minds BPO traced the turnover statistics that recur across the pages ranking for this term back toward their origin. Two of those pages could not be opened and are not represented here. Of the figures we could trace, nine stop before reaching a primary source, and five failure patterns account for all nine. We call them the Five Provenance Failures.
- Stale primary. A real study, correctly reported, with the year quietly dropped somewhere along the citation chain.
- Misattributed primary. A real figure credited to a publisher who did not produce it, or who no longer carries it.
- No primary at all. A number stated in an author’s own voice, with nothing behind it.
- Mis-transcribed primary. A real figure from a real study, restated as a different unit of measurement somewhere in the chain.
- Circular citation. A figure whose only support is another page that also has no primary source.
The figure most often given as the standard call center turnover rate, 30% to 45% annually, traces to a single article: Exploring Call Center Turnover Numbers, published in the Quality Assurance and Training Connection newsletter in Winter 2015. It is a trade newsletter piece. It carries no sample size and no methodology. A contact center software vendor hyperlinked it in a blog post dated 11 March 2016, and the number has been inherited downstream ever since, most recently reprinted as a 2026 benchmark.
There is a further problem, and we checked it rather than assumed it. The original article is no longer online. The URL that publishers have been citing for eleven years returns a 404, tested on 6 September 2026. The most widely quoted statistic in this subject now rests on a page that cannot be read, which means almost nobody repeating the figure has read it either. We have not linked it here for that reason.

Set that against the only large-scale primary research in existence. Cornell ILR’s 2,500-center, 17-country study reported a median total annual turnover of 20%. The industry’s working assumption is roughly double the best measurement anyone has taken, and the assumption is sourced to a newsletter while the measurement is sourced to a university.
| Figure in circulation | Where it traces to | Failure type |
|---|---|---|
| “30% to 45% annual call center turnover” | QATC, Exploring Call Center Turnover Numbers, Connection newsletter, Winter 2015. No sample size, no methodology, and the original page now returns 404 (checked 6 Sep 2026) | Stale primary |
| Attrition rates broken out by country | Cornell ILR Global Call Center Report, 2007, fieldwork 2003 to 2006. Credited on the carrying page to a research network with no year attached | Stale primary |
| “6% of agents absent on a typical day” | Cornell ILR, 2007. The report states a median of 6 sick days per employee per year. A yearly day-count appears to have been restated as a daily percentage somewhere in the chain | Mis-transcribed |
| “8.2 absence days per agent per year” | Credited on the pages carrying it to “a Cornell study”. The report contains no such figure. No other source located | No primary |
| Turnover by center size (17%, 37%, 44%) and by job title (27% down to 6%) | Credited to a named payroll technology company. That company’s live page does not contain the figures | Misattributed |
| “$10,000 to $20,000 to replace one agent” | Attributed to a named Harvard Business Review researcher. No such article was located. The same range appears in consulting material with no study behind it | No primary |
| “Over $35,000 to replace one agent” | Published in an industry association’s own voice, with no citation of any kind | No primary |
| “40% BPO attrition, the highest of any industry in 2023” | Two Philippine outsourcing blogs, neither naming a primary source | No primary |
| “2025 average of 40% to 45%” and “2026 average of 41% to 46%” | A research page carrying no methodology, no sample size, and no per-figure attribution, listing ten hyperlinked sources at the foot tied to none of the individual figures | Circular |
Nine widely republished call center turnover figures and where the citation chain ends. Traced September 2026 against the primary sources named.
The two most quotable numbers in this subject sit in the fourth row. Turnover broken out by center size and by job title is exactly the detail an operator wants, and it appears on one of the most widely cited pages for this topic, credited to a company whose current site does not contain it. That page hyperlinks none of its statistics and shows no publication date.
The closed loop, including our own part in it
The last row deserves its own paragraph, because tracing it produced an uncomfortable result. The “2026 average of 41% to 46%” figure now spreading through industry content originates on a single research page with no methodology, no sample size, and no attribution tying any figure to any source. Ten hyperlinked sources sit at the bottom of that page, connected to nothing in particular.
As of September 2026, one of those ten sources is digitalmindsbpo.com. Our own content sits among the unattributed material behind a number now quoted back at the industry as a 2026 benchmark. We did not publish that figure and we cannot verify it, and because the page ties no figure to any source, we cannot tell whether it came from us. That is what a circular citation looks like from the inside, and it is why every statistic on this page carries its source, its year, and its sample size on its face.
Key Takeaways
- 38% to 45% is the defensible current range for total call center attrition, from four independent named sources (SQM Group 2025, NICE 2024 data, ContactBabel 2024 fieldwork, CCAP 2022). Not the “30% to 45%” that traces to a 2015 trade newsletter.
- Always ask which of three numbers you are looking at. Voluntary, involuntary, or total. The same Philippine BPO industry reported 31%, 14.1%, and 45% for the same year.
- Monthly and annual rates are not interchangeable. BLS JOLTS publishes monthly. Annualizing gives an upper bound, not an annual rate.
- The only large-scale primary study found 20%, about half the industry’s working assumption. It was published in 2007 and we found nothing that has replaced it.
- No dollar cost-per-replacement figure traces to a study. The only sourced one is a ratio: 16% of a worker’s gross annual pay (Cornell ILR, 2007). Build your own from sourcing, training, nesting, supervisor time, and coverage.
- Check the year before you quote the number. Country-level turnover tables presented as current benchmarks are running on 2003 to 2006 fieldwork.
Next Step
Want a team where the attrition number is not the problem?
We run 8 to 10 percent voluntary attrition across all staff, measured annually, from three office-based facilities in Naga City. Tell us what the work is and we will tell you honestly whether we are the right fit for it.
✓ No setup fees · ✓ No recruitment fees · ✓ Team Leader and Project Manager included
Frequently Asked Questions
Where can I find trustworthy statistics on call center turnover?
Four sources publish call center turnover data with enough disclosure to be usable: SQM Group (38% agent attrition, 2025), NICE’s Managing the Modern Contact Center (39% agents and 34% back office, 2024 data), ContactBabel’s US Contact Center Decision-Makers’ Guide (N=192, publishing the distribution rather than an average), and CCAP with Willis Towers Watson for the Philippines (145 organizations, with the voluntary and involuntary split). For a government baseline, US BLS JOLTS publishes monthly separations and quits by industry, though it does not break out call centers.
How do you calculate call center attrition rate, and how do you annualize a monthly figure?
Divide separations during the period by average headcount during the period, then multiply by 100. Average headcount means opening plus closing headcount divided by two, not the headcount on day one. Multiplying a monthly rate by twelve gives an upper bound rather than a true annual figure, because a seat that turns over more than once in the year is counted each time while the denominator counts it once. A 4% monthly rate is not 4% a year; it is somewhere below 48%, and how far below depends on how much churn concentrates in repeatedly refilled seats.
What is the difference between voluntary and involuntary attrition, and which should be benchmarked?
Voluntary attrition counts resignations. Involuntary attrition counts terminations, non-regularizations, and employer-initiated contract endings. Benchmark voluntary attrition when you are assessing whether people want to stay, because that is the number management actions move. Benchmark total attrition when you are sizing recruitment and training load, because every empty seat costs the same to refill. Never compare a voluntary figure from one organization against a total figure from another. CCAP and Willis Towers Watson reported 31% voluntary and 45% total for Philippine BPO in the same year, so the choice moves the answer by 14 points.
What is a good or normal call center attrition rate?
Total annual attrition below 38% beats the SQM Group 2025 average, and below 30% puts an operation in the better half of the ContactBabel 2024 distribution. There is no single normal, because SQM found individual centers ranging from 20% to over 200%. Seasonal high-volume work sits at the top of that range by design; specialist and regulated work sits at the bottom. Those thresholds are total attrition. On the voluntary measure, Digital Minds BPO runs 8 to 10 percent voluntary attrition across all staff, measured annually, against a CCAP voluntary benchmark of 36% in 2021 and 31% in 2022.
Is there good data on average agent attrition rates by geography?
No, and this is where the evidence base is weakest. The only large-scale multi-country dataset is the Cornell ILR Global Call Center Report (2007), covering roughly 2,500 centers across 17 countries, with a median total annual turnover of 20% and a range from 4% in Austria to 40% in India. Its fieldwork ran from 2003 to 2006. Country tables circulating today as current benchmarks are almost always that dataset with the year removed. For single countries, CCAP with Willis Towers Watson covers the Philippines, and US BLS JOLTS covers the sector containing call centers. Beyond those, geographic comparisons rest on vendor estimates rather than measurement.
Conclusion
The honest summary of the evidence on call center turnover is that the range is 38% to 45% depending on what you measure and where, that the best study anyone has run is nineteen years old and found half that, and that most of the specific figures in circulation cannot be traced to anyone who counted anything. Anyone quoting a turnover statistic in a board paper or a business case should be able to name the source, the year, and the population. Three questions, and most published numbers fail at least one.
Digital Minds BPO has operated from Naga City since 2010, across three facilities, with a 94% client retention rate, an average partnership of 4.7 years, and proven capacity to build single-client teams of 50 to 100 or more agents. If low attrition matters to the work you are placing, our call center outsourcing services page sets out how the teams are built and run.

Sofia Reyes is a Content Writer and SEO Specialist at Digital Minds BPO, where she focuses on outsourcing-industry research and educational content for business decision-makers. Based in the Philippines, she has 7 years of experience writing B2B content across SEO, content strategy, and Generative Engine Optimization (GEO). Sofia partners with Digital Minds BPO’s operations and account management teams to translate 15+ years of frontline BPO experience into clear, sourced guides on call center, customer service, and back-office outsourcing. Her work supports prospects evaluating outsourcing decisions across the company’s three dedicated facilities, where the team delivers a 94% client retention rate for clients ranging from Fortune 500 enterprises to growth-stage businesses.