
These 59 accounts payable statistics for 2026 each name the publisher, the edition, and the sample wherever the publisher states one. A closing audit lists 13 widely repeated claims that trace to no current study.
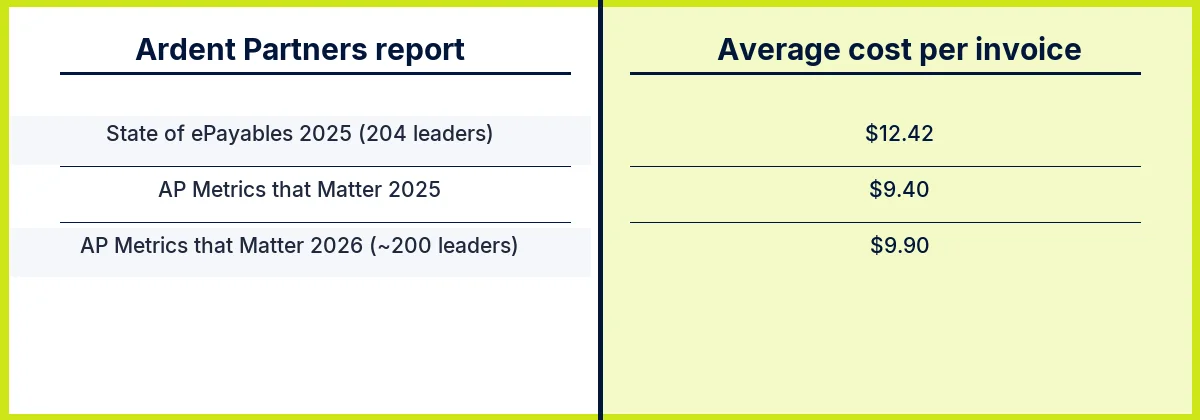
The central finding is that cost per invoice has no single current number. Ardent Partners’ State of ePayables 2025 puts the average at $12.42, its AP Metrics that Matter 2025 report at $9.40, and the 2026 edition of that series at $9.90. One analyst firm published all three, each with a vendor sponsor, and the public pages for the three reports do not reconcile them. Digital Minds BPO, a business process outsourcing company in Naga City, Philippines, compiled this audit from third-party sources; it holds no proprietary accounts payable (AP) benchmark data, and none of the figures describes its own operations.
How These Accounts Payable Statistics Were Sourced
Each figure was read in October 2026 on the publisher’s page or release, on a sponsor’s page hosting the report, or, where the table says so, on a syndicated or secondary page. The table gives every source with its edition, sample, and label.
| Source and edition | Sample and scope | Label |
|---|---|---|
| AFP Payments Fraud and Control Survey 2026 | 465 treasury practitioners at US organizations; January 2026 fieldwork; underwritten by Truist | Independent association survey |
| AFP Payments Fraud and Control Survey 2025 | 521 corporate practitioners; January 2025 fieldwork; underwritten by Truist | Independent association survey |
| Federal Reserve Payments Study 2025 (2024 data) | Top-line Table 1, updated July 1, 2026; all noncash payments, wires excluded, no business-to-business split | Government data |
| US Bureau of Labor Statistics (BLS) | Bookkeeping, accounting, and auditing clerks; May 2025 pay data | Government data |
| Ardent Partners, State of ePayables 2025 (Medius summary of the same edition) | 20th edition, June 2025; 204 AP and finance leaders | Sponsor-funded research |
| Ardent Partners, AP Metrics that Matter 2025, via Thomson Reuters | May 2025; sample not stated | Sponsor-funded research |
| Ardent Partners, AP Metrics that Matter 2026, via Medius | Page updated September 2026; “nearly 200” AP, finance, and procure-to-pay leaders | Sponsor-funded research |
| APQC, Blueprint for Success: Accounts Payable (Second Edition), via a 2018 blog post | Ratios only; no sample or benchmark year stated in the post | Independent benchmarking body |
| IOFM with AvidXchange, 2025 Accounts Payable Career Satisfaction Report (GlobeNewswire release, syndicated) | 588 AP professionals, staff to upper management; May 2025 | Vendor-sponsored survey |
| Ottimate, State of AP Maturity 2026 (syndicated coverage) | 225 mid-market finance leaders ($20M to $499M revenue); September 2025 fieldwork | Vendor-run survey |
| IFOL, AP Automation Trends 2025 | Sample and fieldwork not stated on the report page | Vendor-sponsored, sample not stated |
| Sterling Commerce 2010 survey, via IndustryWeek | June 2010; US and European survey, no sample printed | Historical, secondary; not counted |
| Aberdeen Group 2008 study, via VARinsights | “Hundreds of U.S. Accounts Payable departments” in 2008 | Historical, secondary; not counted |
Figures are as published unless marked as our calculation. Tradeshift, Medius, and Thomson Reuters host or sponsor Ardent’s reports; the full reports are gated.
Ardent, IOFM with AvidXchange, Ottimate, and IFOL are vendor-funded or vendor-run, and each carries that label in every table row, key statistic, and FAQ answer that quotes it. Three things are gated and therefore not quoted: Ardent’s full reports, APQC’s absolute benchmark values, and IOFM’s AP benchmarking data. Where APQC publishes a ratio and not the dollar value, the post quotes the ratio and says so.
The count of 59 gives each published finding one count. A figure travels with its own best-in-class comparison and with any earlier value the same release prints beside it, so each payment method in the Federal Reserve table counts once across its years, and a split of answers to one question counts once. Our own arithmetic, the 2008 and 2010 origin figures, and the audit table are not counted. Market-wide figures sit in our outsourcing statistics roundup; this post covers accounts payable only.
Key Accounts Payable Statistics for 2026
- Cost per invoice: Ardent Partners’ State of ePayables 2025 puts the average at $12.42 against $2.65 for best-in-class, while its AP Metrics that Matter 2026 puts it at $9.90 against $2.67 (both sponsor-funded).
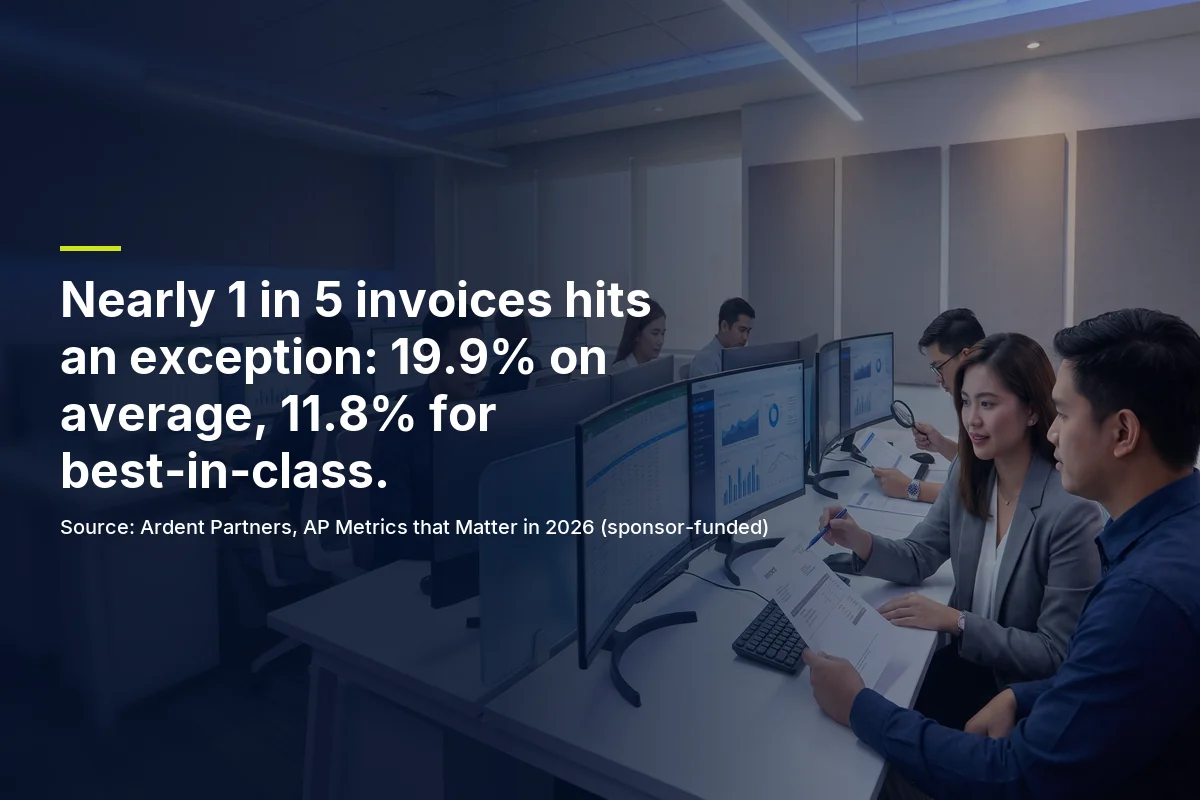
- Exception rate: 19.9% at the average organization against 11.8% at best-in-class (Ardent, AP Metrics that Matter 2026, sponsor-funded).
- Processing time: 8.2 days at the industry average against 2.9 with advanced automation (State of ePayables 2025), and 17.4 days against 3.1 for best-in-class (AP Metrics that Matter 2025). Different reports, different definitions, both sponsor-funded.
- Productivity: APQC’s 2018 ratios say top performers are 5x as productive as bottom performers, and bottom performers need 4x the full-time equivalents (FTEs).
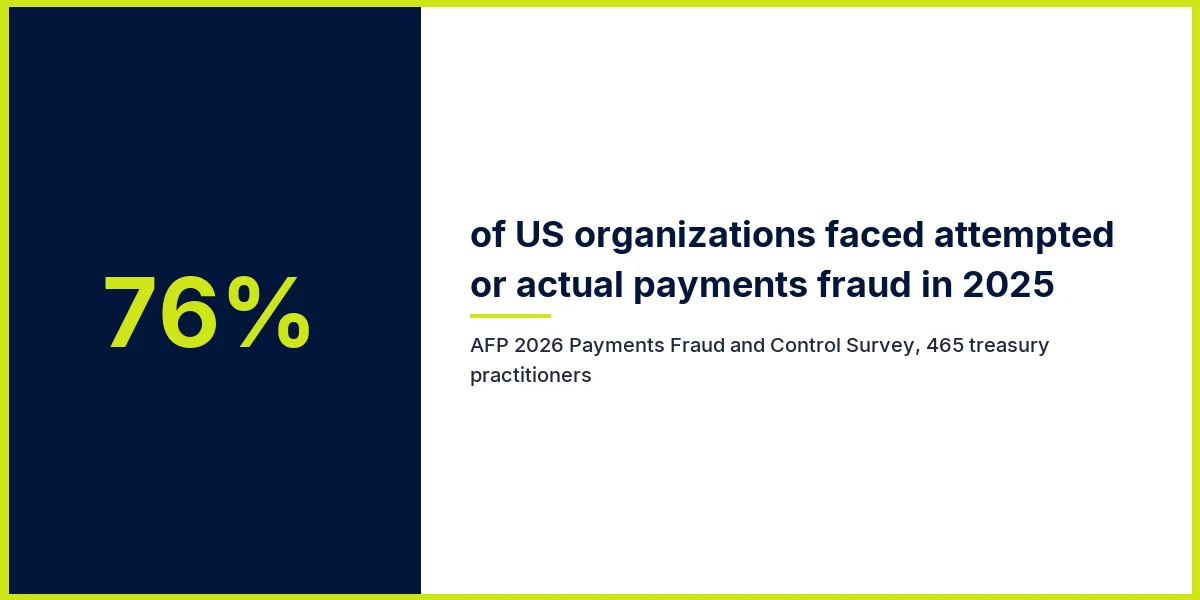
- Fraud: 76% of organizations experienced attempted or actual payments fraud in 2025, and checks were the most targeted method at 58% (AFP 2026, n=465).
- Payment methods: checks were 9.2 billion of 236.6 billion US noncash payments in 2024 (Federal Reserve; all noncash payments, wires excluded, not business-to-business).
- Automation: 4% of 225 mid-market finance leaders report AP fully automated from invoice to payment (Ottimate 2026, vendor-run).
- Workforce: BLS projects a 6% decline for bookkeeping, accounting, and auditing clerks from 2025 to 2035, while 69% of 588 AP professionals say automation would help their role now (IOFM with AvidXchange, 2025, vendor-sponsored).
Cost per Invoice Statistics, Traced to Each Edition
The average cost to process an invoice appears in more versions than any other figure in this post. The table shows every version that traces to a source, with its edition. Call it the edition rule: a cost per invoice without a report name and a year cannot be cited.
| Source and edition | Average or reference | Best-in-class or comparison | Label |
|---|---|---|---|
| Ardent, State of ePayables 2025 (n=204) | $12.42 | $2.65; processing costs 79% lower | Sponsor-funded |
| Ardent, AP Metrics that Matter 2025 | $9.40 | Costs cut 80%; no dollar figure printed | Sponsor-funded |
| Ardent, AP Metrics that Matter 2026 | $9.90 | $2.67 | Sponsor-funded |
| APQC, Blueprint for Success, 2018 post | Dollar values member-gated | Top performers’ cost is one-fifth of the bottom quartile’s; median performers pay twice the top performers’ cost | Independent, ratios only |
| Aberdeen Group, 2008 study | About $15 per invoice | Best-in-class below $4 | Historical, secondary |
| Sterling Commerce, 2010 | $30 for a manual AP invoice | $53.50 to fix a paper invoice error | Historical, secondary |
Figures are as published unless marked as our calculation. Ardent’s best-in-class cut-off is its own and is defined in the gated full reports. The 2008 and 2010 rows are origins and are not counted among the 59.
Inside one edition, the numbers agree with each other. In State of ePayables 2025, $2.65 is 21% of $12.42, which fits the 79% reduction Ardent reports (our calculation). Across editions they do not line up: $12.42 and $9.90 differ by $2.52 (our calculation). They come from two Ardent report series, State of ePayables (204 respondents) and AP Metrics that Matter (nearly 200 in 2026, none stated in 2025). The likeliest explanation is different samples and definitions; that is our inference, because the full reports are gated.
Two other numbers circulate as Ardent’s 2025 figure, $10.89 and $12.88. Neither appears on the sponsor pages for Ardent’s 2025 reports, so both sit in the audit table below.
APQC’s ratios are the only independent cost comparison here. The 2018 post summarizing its Blueprint for Success: Accounts Payable states no sample and no benchmark year, so the one-fifth and twofold ratios are directional and dated.
Where the $15 and $53.50 Figures Come From
Aberdeen Group’s study of hundreds of US accounts payable departments in 2008 put an invoice at about $15 and best-in-class below $4. Sterling Commerce’s 2010 survey, reported by IndustryWeek, put a manual AP invoice at $30 and the cost of fixing a paper invoice error at $53.50. Both reach us through secondary coverage, both are more than 15 years old, and neither secondary page prints a sample size, so they appear here as origins only and are not counted among the 59.
To set any published average beside your own labor cost per invoice, divide the minutes your team spends per invoice by 60 and multiply by your fully loaded hourly cost. BLS puts the median wage for bookkeeping, accounting, and auditing clerks at $24.36 per hour (2025), before benefits and overhead.
Invoice Processing Time and Exception Rate Benchmarks
Accounts payable benchmarks for speed come from three reports, and no two measure the same thing. The table keeps each report’s name, and each report’s own label for its comparison groups, beside its numbers.
| Measure | Average or other organizations | Best-in-class or advanced automation | Source and label |
|---|---|---|---|
| Exception rate | 19.9% (average organization) | 11.8% (best-in-class) | Ardent, AP Metrics that Matter 2026; sponsor-funded |
| Days to process | 8.2 days (industry average) | 2.9 days (advanced automation) | Ardent, State of ePayables 2025 (n=204); sponsor-funded |
| Days to process | 17.4 days (industry average) | 3.1 days (best-in-class) | Ardent, AP Metrics that Matter 2025; sponsor-funded |
| Exception rate | 22% (organizations other than best-in-class) | 9% (best-in-class) | Ardent, AP Metrics that Matter 2025; sponsor-funded |
| Invoices taking 5 or more days | 38% of respondents | Not reported | Ottimate 2026 (n=225); vendor-run |

Figures are as published unless marked as our calculation. Ardent defines each measure in its gated full report, and the 8.2-day and 17.4-day figures are not interchangeable.
At 19.9%, roughly one invoice in five is an exception at the average organization in Ardent’s 2026 data.
Between the 2025 and 2026 editions, the comparison rate moved from 22% (organizations other than best-in-class) to 19.9% (the average organization), while the best-in-class rate rose from 9% to 11.8%. That is not a trend. The two editions are different reports with differently labeled comparison groups, the 2025 sample is not stated, and the 2026 sample is nearly 200 respondents.
Ottimate’s State of AP Maturity 2026 adds a mid-market view: 38% of the 225 finance leaders surveyed say invoices take five or more days. Ottimate ran the survey, so the figure carries a vendor-run label.
AP Productivity Metrics: Invoices per FTE
Productivity has the least public data of the four AP metrics in this post. APQC’s 2018 post on the KPIs that set good accounts payable organizations apart gives three ratios in the open and keeps absolute values for members.
| Measure | APQC ratio | Basis |
|---|---|---|
| Productivity (invoices processed) | Top performers are 5x as productive | Top performers against bottom performers |
| Staffing | Bottom performers need 4x the FTEs | Comparison group not named in the post |
| Speed, receipt to payment | Top performers take half the days | Comparison group not named in the post |
APQC, Blueprint for Success: Accounts Payable (Second Edition), via a 2018 blog post. Independent benchmarking body; no sample or benchmark year stated. Ratios only.
A pair of absolute figures, 23,333 invoices per FTE against 6,082, circulates under APQC’s name. APQC’s absolute values are member-gated, so the pair cannot be checked at the source. Divide one by the other and the ratio is 3.8 (our calculation), which does not match the 5x in the 2018 post.
Four accounts payable KPIs anchor this post: cost per invoice, processing time, exception rate, and invoices per FTE. The first three have current public values from Ardent. The fourth has ratios only. For the keying side of invoice work, see our invoice data entry services.
Payments Fraud Statistics for AP Teams
The Association for Financial Professionals (AFP) runs the annual payments fraud survey behind both tables. Respondents are treasury and corporate payments practitioners, so the findings cover whole organizations, of which AP is one part.
| AFP 2026 (n=465, 2025 activity) | Share of respondents |
|---|---|
| Experienced attempted or actual payments fraud | 76% |
| Affected by business email compromise (BEC) | 74% |
| Checks, the most targeted payment method | 58% |
| ACH debits | 30% |
| Wires | 25% |
| Use AI against payments fraud | 17% |
Independent association survey, January 2026 fieldwork, underwritten by Truist.
| AFP 2025 (n=521, 2024 activity) | Share of respondents |
|---|---|
| Victims of attempted or actual payments fraud | 79% (down 1 point) |
| Affected by BEC | 63% |
| Spoof emails, as a share of BEC | 79% |
| Vendor imposter fraud | 45% (up 11 points) |
| Checks | 63% |
| Wires, the method most targeted by BEC | 63% (39% a year earlier) |
| Recovered 75% or more of losses | 22% (41% a year earlier) |
| Recovered up to 75% of losses | 58% (29% a year earlier) |
Independent association survey, January 2025 fieldwork, underwritten by Truist.
Vendor imposter fraud is the finding closest to the AP desk, because the fraudster poses as one of the company’s suppliers. It rose 11 points to 45% in the 2025 survey. In the same survey, the share recovering 75% or more of their losses fell from 41% to 22%.
The 2026 survey puts checks at 58% as the most targeted method, 5 points below the 63% for checks in the 2025 survey (our calculation). BEC affected 74% of 2026 respondents against 63% of 2025 respondents. Each year’s respondents answered a separate survey, so read both changes as direction only.
Payment Method Statistics: Checks, ACH, and Cards
The Federal Reserve Payments Study counts how the US pays, and its top-line table covers all noncash payments. Wire transfers are excluded, and there is no business-to-business split, so none of these rows describes what AP teams alone pay.
| Payment method | Year | Payments | Value |
|---|---|---|---|
| Checks | 2015 | 17.0 billion | $26.05 trillion |
| Checks | 2021 | 11.0 billion | $26.37 trillion |
| Checks | 2024 | 9.2 billion | $24.45 trillion |
| ACH | 2021 | 36.0 billion | $93.83 trillion |
| ACH | 2024 | 39.7 billion | $104.06 trillion |
| Cards | 2024 | 187.7 billion | $11.50 trillion |
| All noncash payments | 2024 | 236.6 billion | $140.01 trillion |
Federal Reserve Payments Study 2025 (2024 data), top-line Table 1; government data. All noncash payments, wires excluded, no business-to-business split.
Between 2021 and 2024 the check count fell from 11.0 billion to 9.2 billion, about 16%, while the ACH count rose from 36.0 billion to 39.7 billion, about 10% (our calculations). Checks were about 4% of noncash payments by count and about 17% by value in 2024 (our calculation).
AFP’s surveys explain why checks persist. In 2026, 72% of organizations that use checks said they plan to keep using them, and 68% of those cited vendor requirements. In 2025, more than 75% had no plans to reduce check usage over the next two years. That is a statement about plans, so a repeated line that 75% of companies still use paper checks is not what AFP reported (our reading).
Accounts Payable Automation Statistics
Automation figures come almost entirely from vendor-run or sponsor-funded surveys, so every row below carries its label and its sample.
| Ottimate 2026 (n=225 mid-market finance leaders, vendor-run) | Figure |
|---|---|
| Fully automated, invoice to payment | 4% |
| Partially automated | 89% |
| No automation | 7% |
| Little or no cost savings from AP tools | 48% |
| Process 5,000 or more invoices a month | Half |
| Had invoice fraud or overpayment in the past year | 4 in 10 |
| Use manual review as a fraud control | 52% |
| Require two or more approvers | 50% |
Revenue $20M to $499M; September 2025 fieldwork. The 38% who say invoices take five or more days appear in the processing-time table above.
| Source and label | Finding | Figure |
|---|---|---|
| Ardent, AP Metrics that Matter 2026 (nearly 200); sponsor-funded | Using or piloting AI | 58% |
| Ardent, State of ePayables 2025 (n=204); sponsor-funded | Already using AI | 44% |
| Ardent, State of ePayables 2025 (n=204); sponsor-funded | Expect to use AI within 12 months | 75% |
| Ardent, State of ePayables 2025 (n=204); sponsor-funded | Have “comprehensive ePayables” | 46% |
| Ardent, State of ePayables 2025 (n=204); sponsor-funded | Expect AI to have significant transformational impact within two years | 65% |
| IFOL 2025; vendor-sponsored, sample not stated | Spend 10 or more hours a week processing invoices | 63% |
| IFOL 2025; vendor-sponsored, sample not stated | Still enter invoice data into the ERP manually | 66% |
| IFOL 2025; vendor-sponsored, sample not stated | AI adoption | “Quadrupled” (no percentage printed) |
Figures are as published unless marked as our calculation. IFOL is sponsored by Restore Information Management.
Ottimate finds 4% of mid-market organizations fully automated from invoice to payment, yet Ardent finds 58% using or piloting AI. The two measure different things on different samples: piloting a tool is not running a touchless process.
Ardent’s 44% in 2025 and 58% in 2026 come from two different reports, and the 2026 figure counts pilots, so the 14-point gap is a difference between reports.
Ottimate’s control figures show where people stay in the loop: 50% require two or more approvers, and 52% use manual review as a fraud control. In these surveys, automation reaches keying and matching first, while approvals and fraud controls still run through AP staff (our reading). For the case for outsourcing the repetitive part, read our guide to the reasons to outsource invoice processing.
The IFOL report page states no sample or fieldwork dates, so only its 2025 figures appear here, with no year-on-year changes.
Accounts Payable Workforce Statistics
BLS lists accounts payable clerk as one title within bookkeeping, accounting, and auditing clerks, so its figures describe a wider group than AP staff. The IOFM with AvidXchange survey asks AP professionals directly. Its 588 respondents range from staff to upper management, and AvidXchange sponsored it.
| Measure | Figure | Source and label |
|---|---|---|
| Median annual pay | $50,670 ($24.36 per hour) | BLS, 2025; government data |
| Jobs in the occupation | 1,532,400 | BLS, 2025; government data |
| Projected change, 2025 to 2035 | Down 6% (85,600 jobs) | BLS projections; government data |
| Worried about layoffs in 2025 | 45% (27% in 2024) | IOFM with AvidXchange, 2025; vendor-sponsored |
| Say tools and technology support their career growth | 74% | IOFM with AvidXchange, 2025; vendor-sponsored |
| Say automation would help their role now | 69% (72% long term) | IOFM with AvidXchange, 2025; vendor-sponsored |
| Say AI would help their role now | 58% (57% long term) | IOFM with AvidXchange, 2025; vendor-sponsored |
| Task to eliminate: manual approvals | 46% | IOFM with AvidXchange, 2025; vendor-sponsored |
| Task to eliminate: manual data entry | 45% | IOFM with AvidXchange, 2025; vendor-sponsored |
| Task to eliminate: exception handling | 39% | IOFM with AvidXchange, 2025; vendor-sponsored |
Figures are as published unless marked as our calculation. BLS figures cover bookkeeping, accounting, and auditing clerks, not AP staff alone.
Both layoff worry and optimism come from the same 588 people: 45% were worried about layoffs in 2025, up from 27% in 2024, yet 69% said automation would help their role now. The question asks which tasks respondents would eliminate, so it measures appetite for less repetitive work (our reading).
One more IOFM finding needs its context. Among respondents who were “extremely satisfied,” 59% worked in largely or fully automated environments and 2% in fully manual ones. That is a subgroup finding, not an industry share.
BLS projects the occupation to shrink 6% and attributes the decline to technological change: in its words, “software innovations have automated many of the tasks” these clerks perform, so the same work needs fewer employees. BLS does not break the decline out by title, and the IOFM survey finds the tasks AP professionals most want to eliminate are manual approvals and manual data entry. Neither source measures AI replacing AP teams. We read both as automation taking the keying first, while exceptions, controls, and supplier relationships stay with AP staff. For the wider function, see our outsourced accounting services; the same sourcing method applied to another back-office function is in our payroll outsourcing statistics.
Accounts Payable Figures We Could Not Trace to a Current Study
Thirteen claims recur on AP pages with no study behind them, with a study that says something different, or with a study more than 15 years old. A figure on this list may still be true; what is missing is a current source you can cite. Each row names the study and edition where one exists and says “no primary found” where the trail ends without one.
| Figure as repeated | Where the trail ends | Year |
|---|---|---|
| “$15 per manual invoice” | Traces to Aberdeen Group’s 2008 study (about $15 per invoice) through a secondary page; the report itself was not found | 2008 |
| “$2.36 per electronic invoice” | No primary found; an exact search for the figure leads to no Aberdeen or other study | Not dated |
| “14.6 days to process a manual invoice” | Pages attribute it to Aberdeen, to Levvel Research, and to Ardent; no primary found for any of the three | Not dated |
| “39% of invoices contain errors” | Credited to IOFM by repetition, with no study title or year; IOFM’s benchmark data is gated, so the figure cannot be checked at the source; no primary found | Not dated |
| “$53.50 per invoice error” | Traces to Sterling Commerce’s 2010 survey, reported by IndustryWeek; no sample printed | 2010 |
| “20% of companies are fully automated” | No primary found. Aberdeen’s 2007 report said AP automation savings were “currently enjoyed by only 20% of the marketplace,” a different claim and a possible origin (our inference) | 2007 |
| “57% of invoice data is entered manually” | No primary found | Not dated |
| “41% plan to automate in the next 12 months” | Secondary pages credit an IFOL AP automation survey from about 2021 to 2022; not confirmed at the source, and repeated as current | About 2021 to 2022 |
| “23,333 against 6,082 invoices per FTE” | Attributed to APQC, whose absolute values are member-gated; the pair’s ratio is 3.8, against the 5x in APQC’s 2018 post | Not dated |
| “APQC median cost per invoice of $6.00” | Not confirmed at APQC, whose absolute values are member-gated. Pages print $6.00 against 4,821 organizations, $6.00 against 5,846, and $5.83 against about 1,500 | Not dated |
| “$10.89 or $12.88” as Ardent’s 2025 cost per invoice | Neither appears on the sponsor pages for Ardent’s 2025 reports, which print $12.42 and $9.40 | 2025 |
| “75% plan to automate AP in 2026” | No primary found | Claimed for 2026 |
| “63% spend 10 or more hours a week on invoices, up from 52%” | The 63% is IFOL 2025 (sample not stated); the 52% comparison is printed two different ways on different pages, so the change is not quoted | 2025 |
Checked October 2026. A figure on this list may still be true; the row records where the trail ends.
The edition rule tells you what to cite instead. For cost per invoice, name the report: Ardent’s State of ePayables 2025 ($12.42), AP Metrics that Matter 2025 ($9.40), or AP Metrics that Matter 2026 ($9.90), each labeled sponsor-funded. For productivity, quote APQC’s ratios with the year 2018. For payment methods, use the Federal Reserve table and say “all noncash payments, wires excluded.” If a page cites a figure from this audit, ask for the study and the edition; when neither exists, leave the number out.
Conclusion
Cost per invoice, processing time, and exception rate each have current public values, but only by report and edition. Apply the edition rule: cite Ardent’s State of ePayables 2025, AP Metrics that Matter 2025, or AP Metrics that Matter 2026 by name, and keep the 2008 and 2010 figures labeled as history.
Digital Minds BPO has built dedicated teams since 2010. Our outsourced accounts payable services put office-based teams inside your own AP tools, so your people can concentrate on exceptions, controls, and supplier relationships. Teams that also want help on the receivables side can read about our accounts receivable services.
FAQ: Accounts Payable Statistics
What are the key metrics for accounts payable?
The accounts payable metrics with public benchmarks are cost per invoice, processing time, exception rate, and invoices per FTE. Ardent Partners’ sponsor-funded 2026 data gives $9.90 per invoice (best-in-class $2.67) and a 19.9% exception rate (best-in-class 11.8%). For processing time, State of ePayables 2025 reports 8.2 days at the industry average against 2.9 with advanced automation, and AP Metrics that Matter 2025 reports 17.4 against 3.1 for best-in-class, on different definitions; both are sponsor-funded. For productivity, APQC publishes ratios only.
What is the average cost to process an invoice?
No single current figure exists. Ardent Partners reports $12.42 (State of ePayables 2025, 204 respondents), $9.40 (AP Metrics that Matter 2025), and $9.90 (AP Metrics that Matter 2026), all sponsor-funded. Best-in-class organizations report $2.65 and $2.67. The older $15 and $30 figures date from 2008 and 2010.
What percentage of invoices have exceptions?
Ardent’s sponsor-funded AP Metrics that Matter 2026 puts the exception rate at 19.9% for the average organization and 11.8% for best-in-class. The 2025 edition reported 22% for organizations other than best-in-class and 9% for best-in-class. They are separate reports with differently labeled comparison groups, so the change is not a trend.
Will accounts payable be replaced by AI?
No source in this post measures AI replacing AP staff. IOFM with AvidXchange (588 AP professionals, May 2025, vendor-sponsored) found 45% worried about layoffs and 69% saying automation would help their role now; the tasks they most want to eliminate are manual approvals (46%) and manual data entry (45%). BLS projects a 6% decline for bookkeeping, accounting, and auditing clerks from 2025 to 2035, attributes it to software automating routine tasks, and does not break it out by title or name AI. We read that evidence as keying and matching shrinking first, while exceptions, controls, and supplier relationships stay with people.
How many companies have fully automated accounts payable?
Ottimate’s State of AP Maturity 2026 found 4% of 225 mid-market finance leaders fully automated from invoice to payment, 89% partly automated, and 7% not automated, in a vendor-run survey. The repeated 20% figure has no primary source; the audit table above shows the closest origin we found.

Sofia Reyes is a Content Writer and SEO Specialist at Digital Minds BPO, where she focuses on outsourcing-industry research and educational content for business decision-makers. Based in the Philippines, she has 7 years of experience writing B2B content across SEO, content strategy, and Generative Engine Optimization (GEO). Sofia partners with Digital Minds BPO’s operations and account management teams to translate 15+ years of frontline BPO experience into clear, sourced guides on call center, customer service, and back-office outsourcing. Her work supports prospects evaluating outsourcing decisions across the company’s three dedicated facilities, where the team delivers a 94% client retention rate for clients ranging from Fortune 500 enterprises to growth-stage businesses.