These 50 sourced cold calling statistics for 2026 each name the publisher, the year of the data where the publisher gives one, and the type of data behind the number: vendor platform data, buyer survey, seller self-report, or field study. A final section lists 10 widely quoted figures that fail a source check, with the earliest traceable appearance of each.
The central finding is that “success rate” has at least four denominators. Gong’s 2024 platform data puts meetings at 4.6% of conversations for the average rep, yet the same data works out to about 0.25% of dials (our calculation), and both figures are correct. Digital Minds BPO, a business process outsourcing company in Naga City, Philippines, compiled this list from third-party sources; none of the figures describes Digital Minds BPO’s own operations.
Cold Calling Statistics 2026: Key Takeaways
Ten figures carry most of the weight. Each row names the publisher, the year, and the data type; the sections below explain what each number measures.
| Figure | Source, year | Data type |
|---|---|---|
| The average rep connects with 5.4% of prospects; the top quartile connects with 13.3% | Gong, 2024 (300M+ calls) | Vendor platform data |
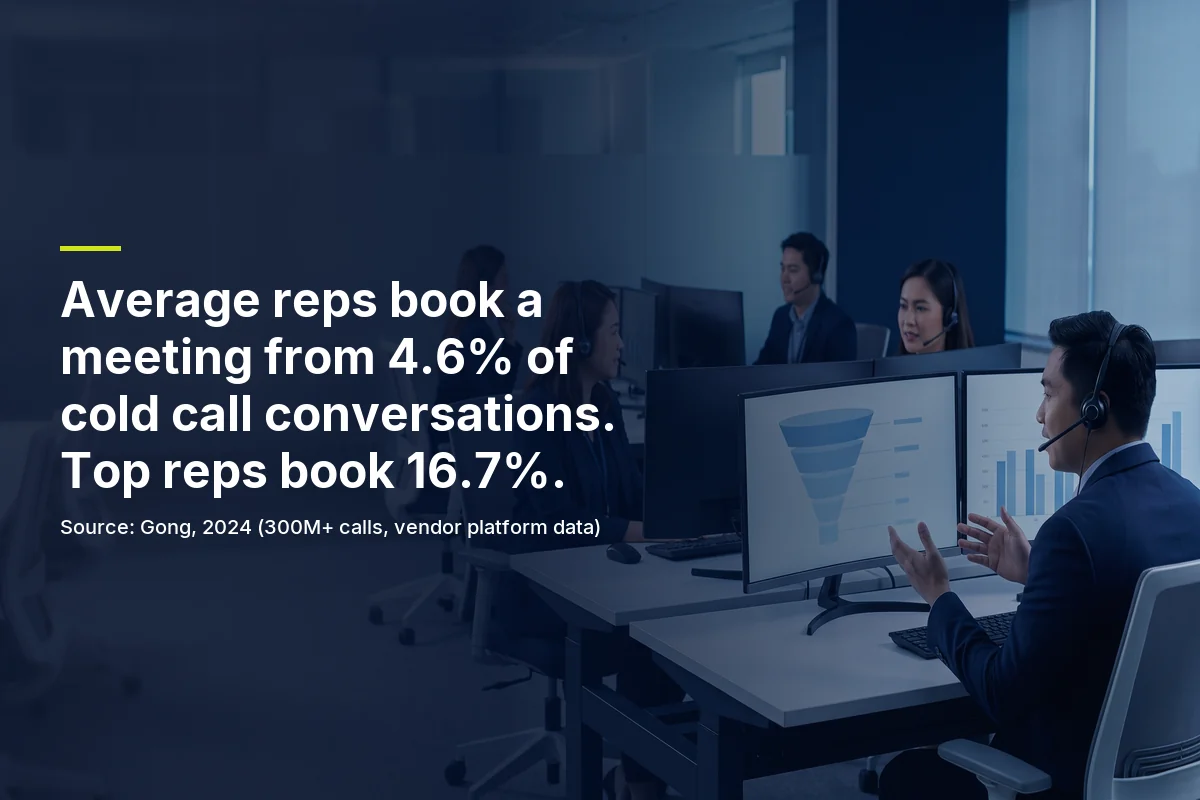
| Meetings booked per conversation: 4.6% for the average rep, 16.7% for top reps | Gong, 2024 | Vendor platform data |
| Industry average cold calling success rate of 2.7%, up from 2.3% in 2025 | Cognism, 2026 (200K+ calls) | Vendor platform data |
| About one appointment per 330 calls (our arithmetic: 6,264 calls, 19 appointments) | Baylor Keller Center, 2012 report (50 agents) | Field study |
| Eight in ten Americans say they do not generally answer unknown-number cellphone calls | Pew Research Center, 2020 (10,211 adults) | Consumer survey |
| 93% of the conversations in the dataset happened by call 3 | Cognism, 2025 | Vendor platform data |
| 82% of buyers accept meetings with sellers who reach out proactively | RAIN Group, 2018 (488 buyers) | Buyer survey |
| 35% of cold-calling professionals report a 2-5% conversion rate to appointments | HubSpot, April 2025 (379 professionals) | Seller self-report |
| 60% of SDRs are at quota, the lowest in the study’s history | The Bridge Group, 2025 (351 B2B companies) | Seller self-report |
| Average meeting no-show rate of 15.9% | RevenueHero (18 weeks of data) | Vendor platform data |
Figures are as published unless marked as our calculation or our arithmetic. Sample sizes and definitions appear in the sections that follow.
How We Sourced These Numbers
Every figure was checked against the publisher’s own page in October 2026. Two grades apply.
- Grade A, confirmed at the primary source. We opened the publisher’s page and found the number in the publisher’s own wording. Every statistic in the body is Grade A.
- Grade B, reachable only through a named secondary. No Grade B figure is used in the body. A figure that fit neither grade went to the audit section at the end.
| Data type | What it measures | Used here | Main limit |
|---|---|---|---|
| Vendor platform data | What happened on a vendor’s own product | Gong, Cognism, Orum, Klenty, RevenueHero | Describes that vendor’s customers, not all sellers |
| Buyer survey | What buyers and consumers say | RAIN Group 2018, Pew 2020 | Stated behavior, not recorded behavior |
| Seller self-report | What sales professionals and companies say they do | HubSpot 2025, The Bridge Group 2025, RAIN Group 2018 (sellers) | Each respondent picks a denominator |
| Field study | Observed calls in a defined sample | Baylor Keller Center (calls placed 2011) | Small sample, one industry |
The four data types in this post. Each statistic is labelled with its type where it appears.
Vendor platform data is not a survey. The sample is whoever uses the product, and the reps are not randomly chosen. Cognism’s call data comes from an outbound lead-generation partner. A survey asks a defined group a fixed question, so it measures what people say, not what happened. Both are useful, and neither measures all cold calling.
The count of 50 gives each distinct finding one count. An average reported with its top-performer comparison, or a measure with its prior-year value, is one finding; each edition of a repeated measure, such as Cognism’s call length, counts separately. Gong’s 800-dial worked example and our own arithmetic are not counted, and published counts behind a rate we calculated count once. The same grading runs through our call center benchmarks audit.
Connect Rate and Dials-per-Conversation Statistics
Connect rate is the first number in any outbound funnel, and publishers define it differently. Gong reports the share of prospects a rep connects with. Keller’s field study recorded whether each call was answered. Cognism counted connected calls, then how many became conversations.
| Measure | Figure | Source, year, sample | Data type |
|---|---|---|---|
| Share of prospects the average rep connects with | 5.4% (top quartile 13.3%) | Gong, 2024, 300M+ calls | Vendor platform data |
| Cold calls needed to get one conversation | 19 for the average rep; 8 for the top quartile | Gong, 2024 | Vendor platform data |
| Calls answered, not answered, non-working number | 28%, 55%, 17% | Baylor Keller Center, 2012 report, 50 real-estate agents, 6,264 calls | Field study |
| Americans who say they do not generally answer unknown-number cellphone calls | 8 in 10 | Pew Research Center, 14 December 2020, 10,211 US adults | Consumer survey |
| Americans who say they skip unknown calls but check voicemail | 67% | Pew Research Center, 2020 | Consumer survey |
| Connected calls that became conversations | 65.6% (27,513 of 41,936) | Cognism, 2025 | Vendor platform data |
The 65.6% is our calculation from the two counts Cognism published. Gong’s rates describe Gong customers; Keller’s sample is one industry.
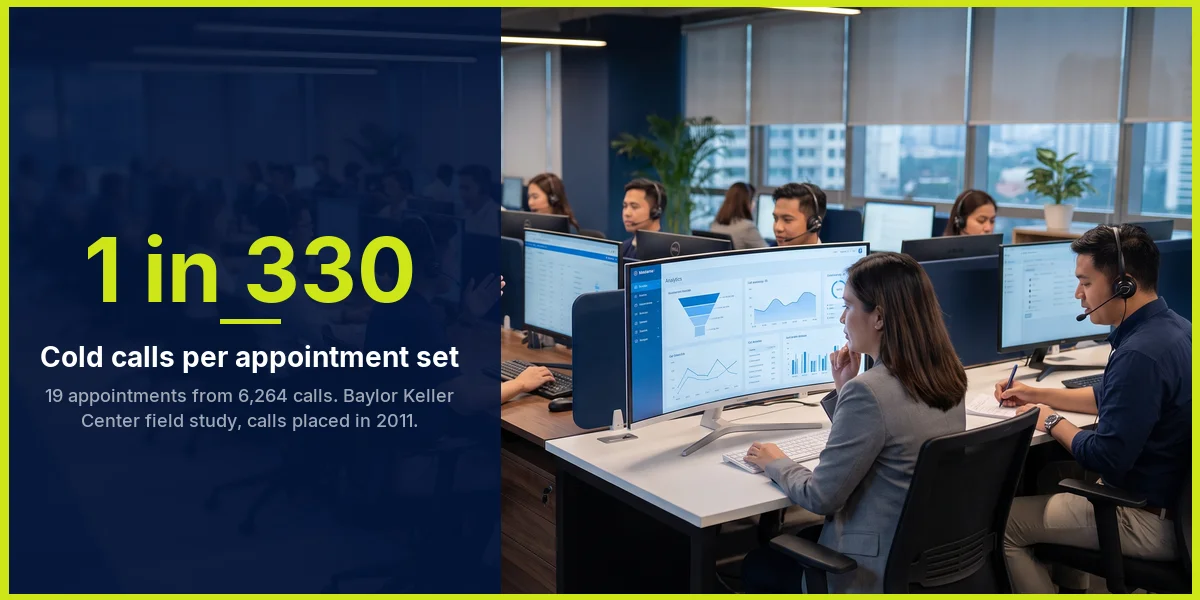
Keller’s calls were placed in November 2011 by agents in one industry, so the study is a case, not a benchmark. Its 28% answered share and Gong’s 5.4% connect rate use different definitions, industries, and eras, and should not be set side by side. Pew surveyed consumers, not business buyers; it reports what the people cold callers dial say they do, and it measures no B2B answer rates.
Cold Calling Conversion Rate and Success Rate Statistics
Cold calling conversion rate is not one number. Each published figure divides a different count of meetings by a different count of activity, so the definitions come first.
| Denominator | Figure | Source |
|---|---|---|
| Held meetings per connected call (our reading) | As low as 1.48% | Gong Labs, 29 March 2018, 90,380 connected outbound calls. Gong defined a successful call as one “that ended up in a held follow-up meeting” |
| Meetings booked per conversation | 4.6% average rep; 16.7% top reps | Gong, 2024, 300M+ calls |
| Meetings booked per conversation (definition from Cognism 2025) | 2.7% (2.3% in 2025) | Cognism, 2026, 200K+ calls. The 2025 report defines success as “the number of conversations that resulted in a meeting booked” |
| Appointments per call placed (our arithmetic) | About 1 in 330 | Baylor Keller Center, 2012 report: 19 appointments from 6,264 calls |
| Meeting-to-conversation rate | 12% in 2024, up from an all-time 11% | Orum, 2024 data, published January 2025 |
| Meeting booking rate (denominator not stated in the lines we confirmed) | Monday 3.58%; Wednesday 3.41% | Klenty, post dated 30 June 2026, 384,058 calls. Klenty calls the differences subtle |
Labels marked “our reading” or “our arithmetic” are our interpretation. Other figures are as the publisher states them.
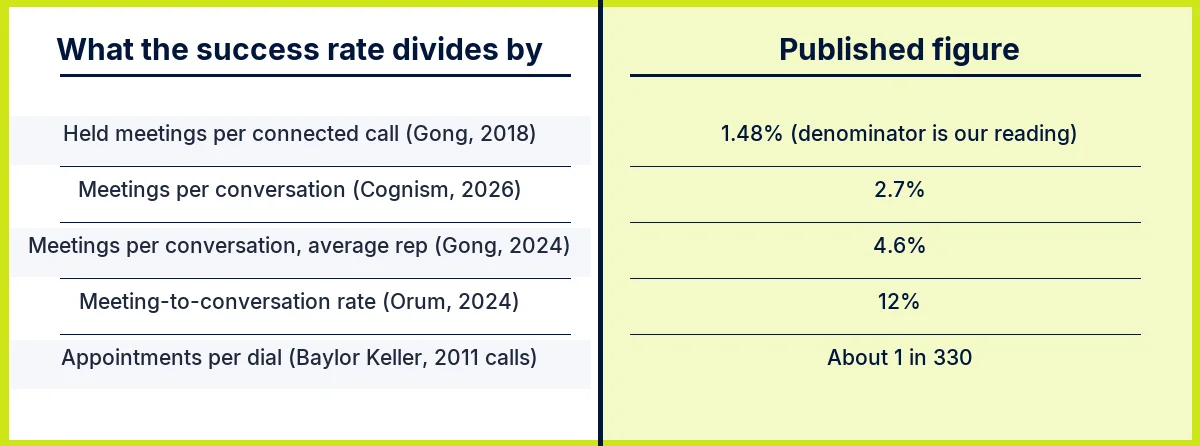
Orum’s 12% also divides by conversations, yet it reads far above Gong’s 4.6% and Cognism’s 2.7%. Orum defines a conversation as a call lasting longer than one minute, and the datasets cover different customers and years, so the three rates are not interchangeable. We found no definition on Cognism’s 2026 page, so the 2025 definition is applied as an assumption.
An operator measures the funnel in stages. Multiplying Gong’s 2024 stage rates gives a per-dial figure.
| Stage | Average rep | Top rep |
|---|---|---|
| Connect rate (Gong, 2024) | 5.4% | 13.3% |
| Meetings per conversation (Gong, 2024) | 4.6% | 16.7% |
| Meetings per dial (our calculation) | 0.25%, about 1 in 400 | 2.2%, about 1 in 45 |
| Meetings from 800 dials in a month (Gong’s worked example, not a measurement) | 2 | 18 |
Gong labels the 13.3% connect rate “top quartile” and the 16.7% meeting rate “top reps”; the top-rep column assumes they are the same group. Our calculation multiplies Gong’s connect rate by its meeting rate, treating a connect as a conversation; Gong’s 19 dials per conversation (about 5.3%, our arithmetic) fits that. Keller’s independent 1 in 330 sits near the average rep’s 1 in 400.
HubSpot’s April 2025 State of Cold Calling (379 sales professionals, surveyed with Panoplai) found 35% of respondents who cold call as a major part of their day reporting a 2-5% conversion rate to appointments. Respondents pick their own denominator, so the figure shows what sellers report, not what calls produced. Gong’s 2024 data adds one cross-channel comparison: cold calling nearly doubles an email reply rate (3.44% vs 1.81%).
Best Time to Cold Call and Call Length Statistics
The same dataset can change its answer from one year to the next. Cognism’s three annual reports show it.
| Measure | 2024 | 2025 | 2026 |
|---|---|---|---|
| Average cold call length | 83 seconds | About 93 seconds | 82 seconds |
| Best day to cold call | Not verified | Tuesday | Not verified (Friday “still trails behind the rest of the week”) |
| Average calls needed to reach a prospect | Not verified | 2.9 | 1.55 |
| Calls in the dataset | 10,000 | Not verified | 200K+ |
Cognism State of Cold Calling, 2024 to 2026 editions; vendor platform data. “Not verified” means we could not confirm the figure in that edition’s wording.
A call length that moves from 83 to 93 to 82 seconds, on a dataset that grew from 10,000 to 200K+ calls, is a reason to read vendor benchmarks as one-year snapshots.
Orum’s 2024 platform data says connect rates are highest at the start of the day, peaking at 10 am local time. Mondays had a slightly higher connect rate than any other day, but Tuesdays and Wednesdays saw the most conversations and meetings booked. Those last two are counts, not rates, so they can rise with call volume alone. Keller’s 2011 field study found 10am to 2pm the most effective window. The datasets disagree on a best day: Tuesday (Cognism, 2025), Tuesday and Wednesday for meetings booked (Orum, 2024), Monday ahead of Wednesday on booking rate (Klenty, 2026).
On call length, the 2018 Gong Labs analysis found the average longest burst of talking by a rep was 37 seconds on successful cold calls and 25 seconds on unsuccessful ones. Gong’s cold calling page (undated, so not 2018 data) reports that successful calls average 5:50 and unsuccessful calls 3:14. Cognism’s 82 seconds averages every call in its dataset, while Gong’s figures split calls by outcome, so the two do not conflict, and neither shows that a longer call causes a meeting.
A May 2017 Gong Labs study (no sample stated) found that a meeting set for 4 pm has 30% greater odds of the prospect showing up than one set for 8 am. It measures attendance, not connects.
Sales Follow-Up Statistics: How Many Attempts It Takes
Follow-up figures come in two kinds: measured timing from vendor data, and what sellers say they do.
| Measure | Figure | Source, year, sample | Data type |
|---|---|---|---|
| Share of all conversations that happened by call 3; by call 5 | 93%; 98.6% | Cognism, 2025 | Vendor platform data |
| Callbacks arriving within 1.75 hours of the rep’s call; within 24 hours | 75%; 91% | Orum, 2024 data | Vendor platform data |
| Sellers who say it takes 5 to 10 touches to connect with a new prospect | 52% | RAIN Group, January 2018 release, 489 sellers | Seller self-report |
| Cold callers who make 3 to 5 attempts before moving on | 55% | HubSpot, April 2025, 379 professionals | Seller self-report |
RAIN’s figure comes from a press release, not the full report.
Cognism’s 93% and 98.6% are shares of the conversations in its dataset, not the chance that one prospect answers on call 3. In our reading, they describe when conversations happened among prospects who were eventually reached. The 2026 edition puts the average at 1.55 calls to reach a prospect, down from 2.9 in 2025.

RAIN counts “touches,” which can span channels, while HubSpot counts call attempts, so 5 to 10 and 3 to 5 are not the same measure. Both are self-reports. Cognism and Orum are the measured sources here.
Buyer Attitude Statistics: Is Cold Calling Still Effective?
RAIN Group’s 2018 research (488 buyers; RAIN sells sales training) is the only survey of buyers about sales outreach in this set, and it is eight years old. HubSpot’s 2025 survey shows how sellers see the channel.
| Finding | Figure | Source, year, respondents |
|---|---|---|
| Buyers who accept meetings with sellers who reach out proactively | 82% | RAIN Group, 2018, 488 buyers |
| Buyers who accept meetings and want to talk to sellers early | 71% | RAIN Group, 2018 |
| Channel of the most recent meeting a buyer agreed to | 58% email; 54% phone | RAIN Group, 2018 |
| Sales meetings that are not valuable to buyers | 58% | RAIN Group, 2018 |
| Sales professionals employed by an organization that cold calls in some capacity | 68% (24% call it the primary channel) | HubSpot, April 2025, 379 professionals |
| Professionals who call cold calling “somewhat effective” | 52% | HubSpot, April 2025 |
| Regular callers whose call volume rose year over year | 63% | HubSpot, April 2025 |
| Biggest challenges: overcoming initial rejection; getting past gatekeepers | 44%; 40% | HubSpot, April 2025 |
RAIN is a buyer survey; HubSpot is seller self-report. The RAIN channel shares add to more than 100%, so respondents could name more than one channel.
So is cold calling still effective? These figures do not settle it, because none reports revenue or closed deals. They show that buyers accepted proactive meetings (RAIN, 2018), that sellers still use the channel and most regular callers report rising volume (HubSpot, 2025), and that per-dial yield stays low (Gong, 2024).
SDR Metrics and Benchmarks (Bridge Group 2025)
The Bridge Group’s 2025 SDR Models, Motions & Metrics report (10th edition, 351 B2B companies) is a survey of companies by an SDR consultancy. Compensation figures are US dollars for US roles and should not be read as pay anywhere else.
| Metric | 2025 figure | Context |
|---|---|---|
| SDRs at quota | 60% | Lowest reported in the study’s history |
| Average ramp time | 3.0 months | Lowest since 2010 |
| Average SDR tenure | 1.9 years | Highest since the early 2010s |
| Median on-target earnings (US) | $80K ($55K base, $25K variable; 68:32 split) | Unchanged since 2022 |
| Quality conversations per SDR per day | 4.1 | First rebound in the study’s history |
| Median total daily activities | 112 (44 phone, 41 email, 19 LinkedIn, 8 text and other) | Activities, not dials |
| SDRs per account executive | 1 SDR to 2.4 AEs | Consistent since 2018 |
| SDRs per leader | 6.4 | Down from 8 in 2021 to 2023 |
The Bridge Group, 2025 SDR Models, Motions & Metrics, 10th edition. Company survey; compensation in US dollars.
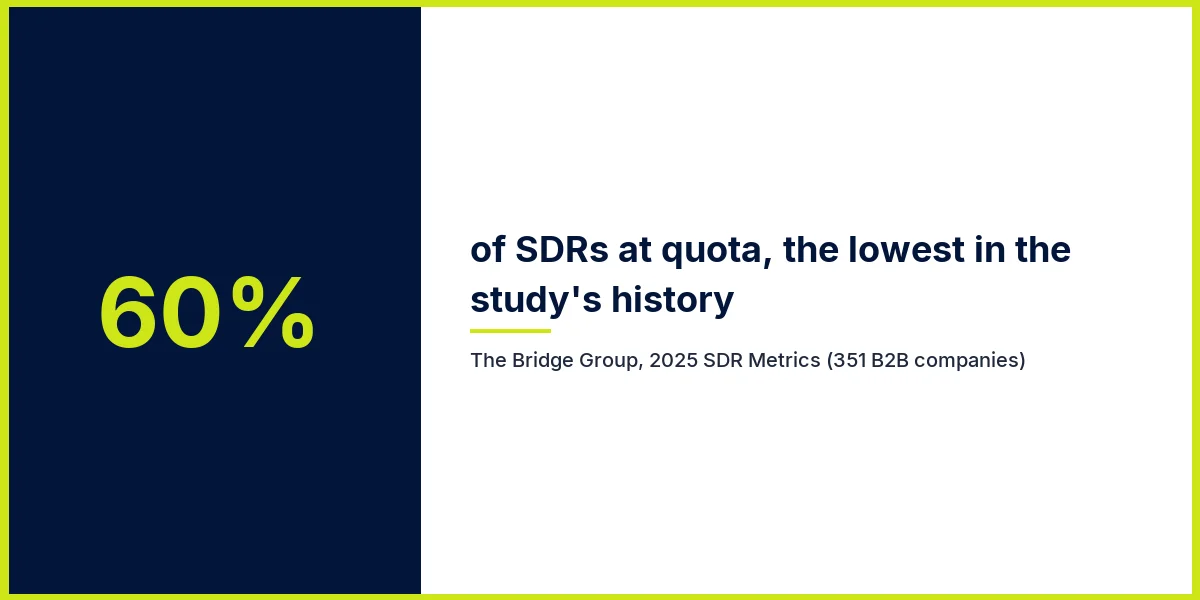
On the averages, a 3.0-month ramp is about 13% of a 1.9-year tenure (our calculation), so about one month in eight of an average SDR’s tenure goes to ramping. For contact center attrition, audited the same way, see our call center turnover statistics.
Appointment Setting and No-Show Statistics
Independent data on appointment-setting show rates is thin. The two figures traced here come from a scheduling vendor and a 2017 conversation-analytics study. RevenueHero does not say what share of its meetings came from outbound calling, and Gong’s 2017 study states no sample.
| Measure | Figure | Source, sample | Data type |
|---|---|---|---|
| Average meeting no-show rate (median 13.5%; top 10% of companies 5.5%) | 15.9% | RevenueHero, 18 weeks of data, customers booking 50+ meetings a month | Vendor platform data |
| No-show rate on weekend meetings | About 4x a typical weekday | Gong Labs, 2017, no sample stated | Vendor platform data |
RevenueHero is a scheduling vendor, and its mix of inbound and outbound bookings is unknown.
Treat both as context for planning confirmation steps, not as targets. For wider industry figures, see our call center statistics roundup.
AI-Assisted Cold Calling Statistics
HubSpot’s April 2025 survey of 379 sales professionals found that 23% use AI tools extensively to support their cold calling efforts. The question concerns tools that support the person making the call, and the figure says nothing about how well they work. Vendor product claims that state no method were left out.
10 Cold Calling Statistics That Fail a Source Check
Ten figures recur across cold calling pages without a source that shows a method. Each row records where the trail ends in October 2026, after an exact-string search for each figure. A failed figure may still be true; we found no one who shows how it was measured.
| Figure as printed | Earliest traceable appearance | Why it fails |
|---|---|---|
| F1. “80% of sales require 5 follow-up calls” | Water Tech Online, February 2016, crediting a National Association of Sales Professionals blog post. Older origins are reported by tracing posts and are not verified, so they are not stated here | No sample or method in anything readable |
| F2. “44% of salespeople give up after one follow-up” (also printed as “48% never follow up”) | The same 2016 page, with the same credit | Two numbers for one claim; no method |
| F3. “2% of cold calls result in an appointment” | Social Media Today, April 2008: “An industry rule of thumb holds that only about 2% of cold calls produce solid prospects” | A rule of thumb about “solid prospects,” not appointments. Keller and Gong measured appointments and meetings directly |
| F4. “92% of all customer interactions happen over the phone” | CMSWire, January 2013: “92 percent of customer service interactions still take place over the phone,” credited to a Five9 infographic | About customer service, not sales; the study was not located |
| F5. “It takes 18 dials to connect” | Credited to a TOPO report in search results; no primary source reachable | No primary and no date. Gong’s measured 2024 figure is 19 dials per conversation, from separate data |
| F6. “4-5 PM is 71% more effective than 11 AM-12 PM” | Traced to a dialer vendor’s survey; the vendor’s current page no longer shows the line | No method, and the source no longer states it. Orum’s connect rate peaks at 10 am, and Keller found 10am to 2pm most effective |
| F7. “The best day to cold call is Wednesday or Thursday” | Gong’s blog credits InsideSales.com, with no method | Measured datasets disagree: Tuesday (Cognism 2025), Tuesday and Wednesday (Orum 2024), Monday ahead of Wednesday (Klenty 2026) |
| F8. “Cold calling success rates are 50% higher on Wednesdays” | Credited to Klenty (2024) | Klenty’s own 384,058-call analysis shows Monday at 3.58% against Wednesday at 3.41% |
| F9. “57% of C-level buyers prefer the phone” | Credited to RAIN Group on many pages and to Crunchbase on others; not in RAIN’s 2018 release | Conflicting attribution; no primary found |
| F10. “78% of decision-makers took an appointment or attended an event from a cold call” | Credited to HubSpot but absent from HubSpot’s page; search traces it to a vendor eBook | The citation chain fails; no method stated |
Ten widely repeated cold calling figures and where the trail ends. Checked October 2026 against the primary sources named in this post.

What to cite instead: for follow-up, Cognism’s measured curve (93% of conversations by call 3, 2025), with HubSpot’s 55% labelled as self-report. For yield, state the denominator and cite Gong or Keller. For timing, cite one dataset with its year and say the datasets disagree. F4 needs no replacement, because customer service contact channels are a different subject. If a page cites a figure from this list, ask for the study and the method; if neither can be produced, leave the number out.
Using These Cold Calling Statistics
Before quoting any figure here, state its denominator and its data type. A team judged on meetings per dial and a team judged on meetings per conversation will report numbers an order of magnitude apart, 0.25% against 4.6% in the same Gong data by our arithmetic, and both will be right.
Digital Minds BPO has built dedicated teams since 2010 from three office-based facilities in Naga City, with a 94% client retention rate and an average partnership of 4.7 years. If you are setting targets for an outsourced outbound team, our telemarketing services and appointment setting pages describe how those teams are run, and our outbound call center service covers the wider scope.
Next Step
Building an outbound team you can measure?
Tell us your target market, call volumes, and the meeting definition you track. We will start from the sourced figures above and tell you honestly whether we are the right fit for the work.
✓ No setup fees · ✓ No recruitment fees · ✓ Team Leader and Project Manager included
Frequently Asked Questions About Cold Calling Statistics
What’s the success rate of cold calling?
It depends on what you divide by. Gong’s 2024 platform data has the average rep booking a meeting from 4.6% of conversations, and Cognism’s 2026 report gives an industry average of 2.7% of conversations. By our calculation Gong’s average works out to about 0.25% of dials, close to Keller’s 1 in 330. State the denominator next to the percentage.
Is cold calling dead in 2026?
The data does not show it dead, and it does not show it healthy. HubSpot’s April 2025 survey found that 68% of sales professionals work for an organization that cold calls, and 63% of regular callers said their call volume rose year over year. Yield is low (Gong, 2024: the average rep connects with 5.4% of prospects and books a meeting from 4.6% of conversations), and no source here reports revenue from the channel.
How many cold calls per day is normal?
The Bridge Group’s 2025 report (351 B2B companies) gives a median of 44 phone activities per SDR per day, within 112 total daily activities, and 4.1 quality conversations per SDR per day. Phone activities are the report’s own category, so do not read 44 as a dial count.
What is the 80/20 rule in cold calling?
We found no authoritative definition of an 80/20 rule in cold calling, so none is given here. The phrase is often confused with the unsourced claim that 80% of sales require five follow-up calls, which fails a source check (F1 in the audit above). Cite neither.
How many dials does it take to reach one person?
Gong’s 2024 data puts it at 19 cold calls per conversation for the average rep and 8 for a top-quartile rep. Cognism’s 2026 report gives 1.55 calls on average to reach a prospect, down from 2.9 in 2025. The two measure different things: Gong counts dials across every number called, while Cognism’s figure comes from its conversation data and, in our reading, describes prospects who were eventually reached.

Sofia Reyes is a Content Writer and SEO Specialist at Digital Minds BPO, where she focuses on outsourcing-industry research and educational content for business decision-makers. Based in the Philippines, she has 7 years of experience writing B2B content across SEO, content strategy, and Generative Engine Optimization (GEO). Sofia partners with Digital Minds BPO’s operations and account management teams to translate 15+ years of frontline BPO experience into clear, sourced guides on call center, customer service, and back-office outsourcing. Her work supports prospects evaluating outsourcing decisions across the company’s three dedicated facilities, where the team delivers a 94% client retention rate for clients ranging from Fortune 500 enterprises to growth-stage businesses.